
CRE This Week: What's impacting the Canadian market
September 30, 2026 - Canada commercial real estate market insights, indicators, and notable transactions
September 30, 2026
Welcome to the latest edition of CRE This Week, powered by Altus Data Studio.
Our team has handpicked new and noteworthy market indicators, articles, and significant industry transactions that are impacting Canada's commercial real estate sector. We understand that your time is valuable, so we're excited to deliver research that helps you stay informed and saves you some time each Wednesday morning.

FEATURED TrANSACTIONS
Canada property transactions

Greater Toronto Area: Retail
221 Lakeshore Road East, Oakville
$7,000,000
$475 per sq. ft.
Broker(s): Rocco Trigiani (CDN Global Indusite Realty)

Greater Vancouver Area: Retail
Unit 101, 2083 Alma Street, Vancouver
$5,050,000
$767 per sq. ft.
Broker(s): Re/Max Select Properties
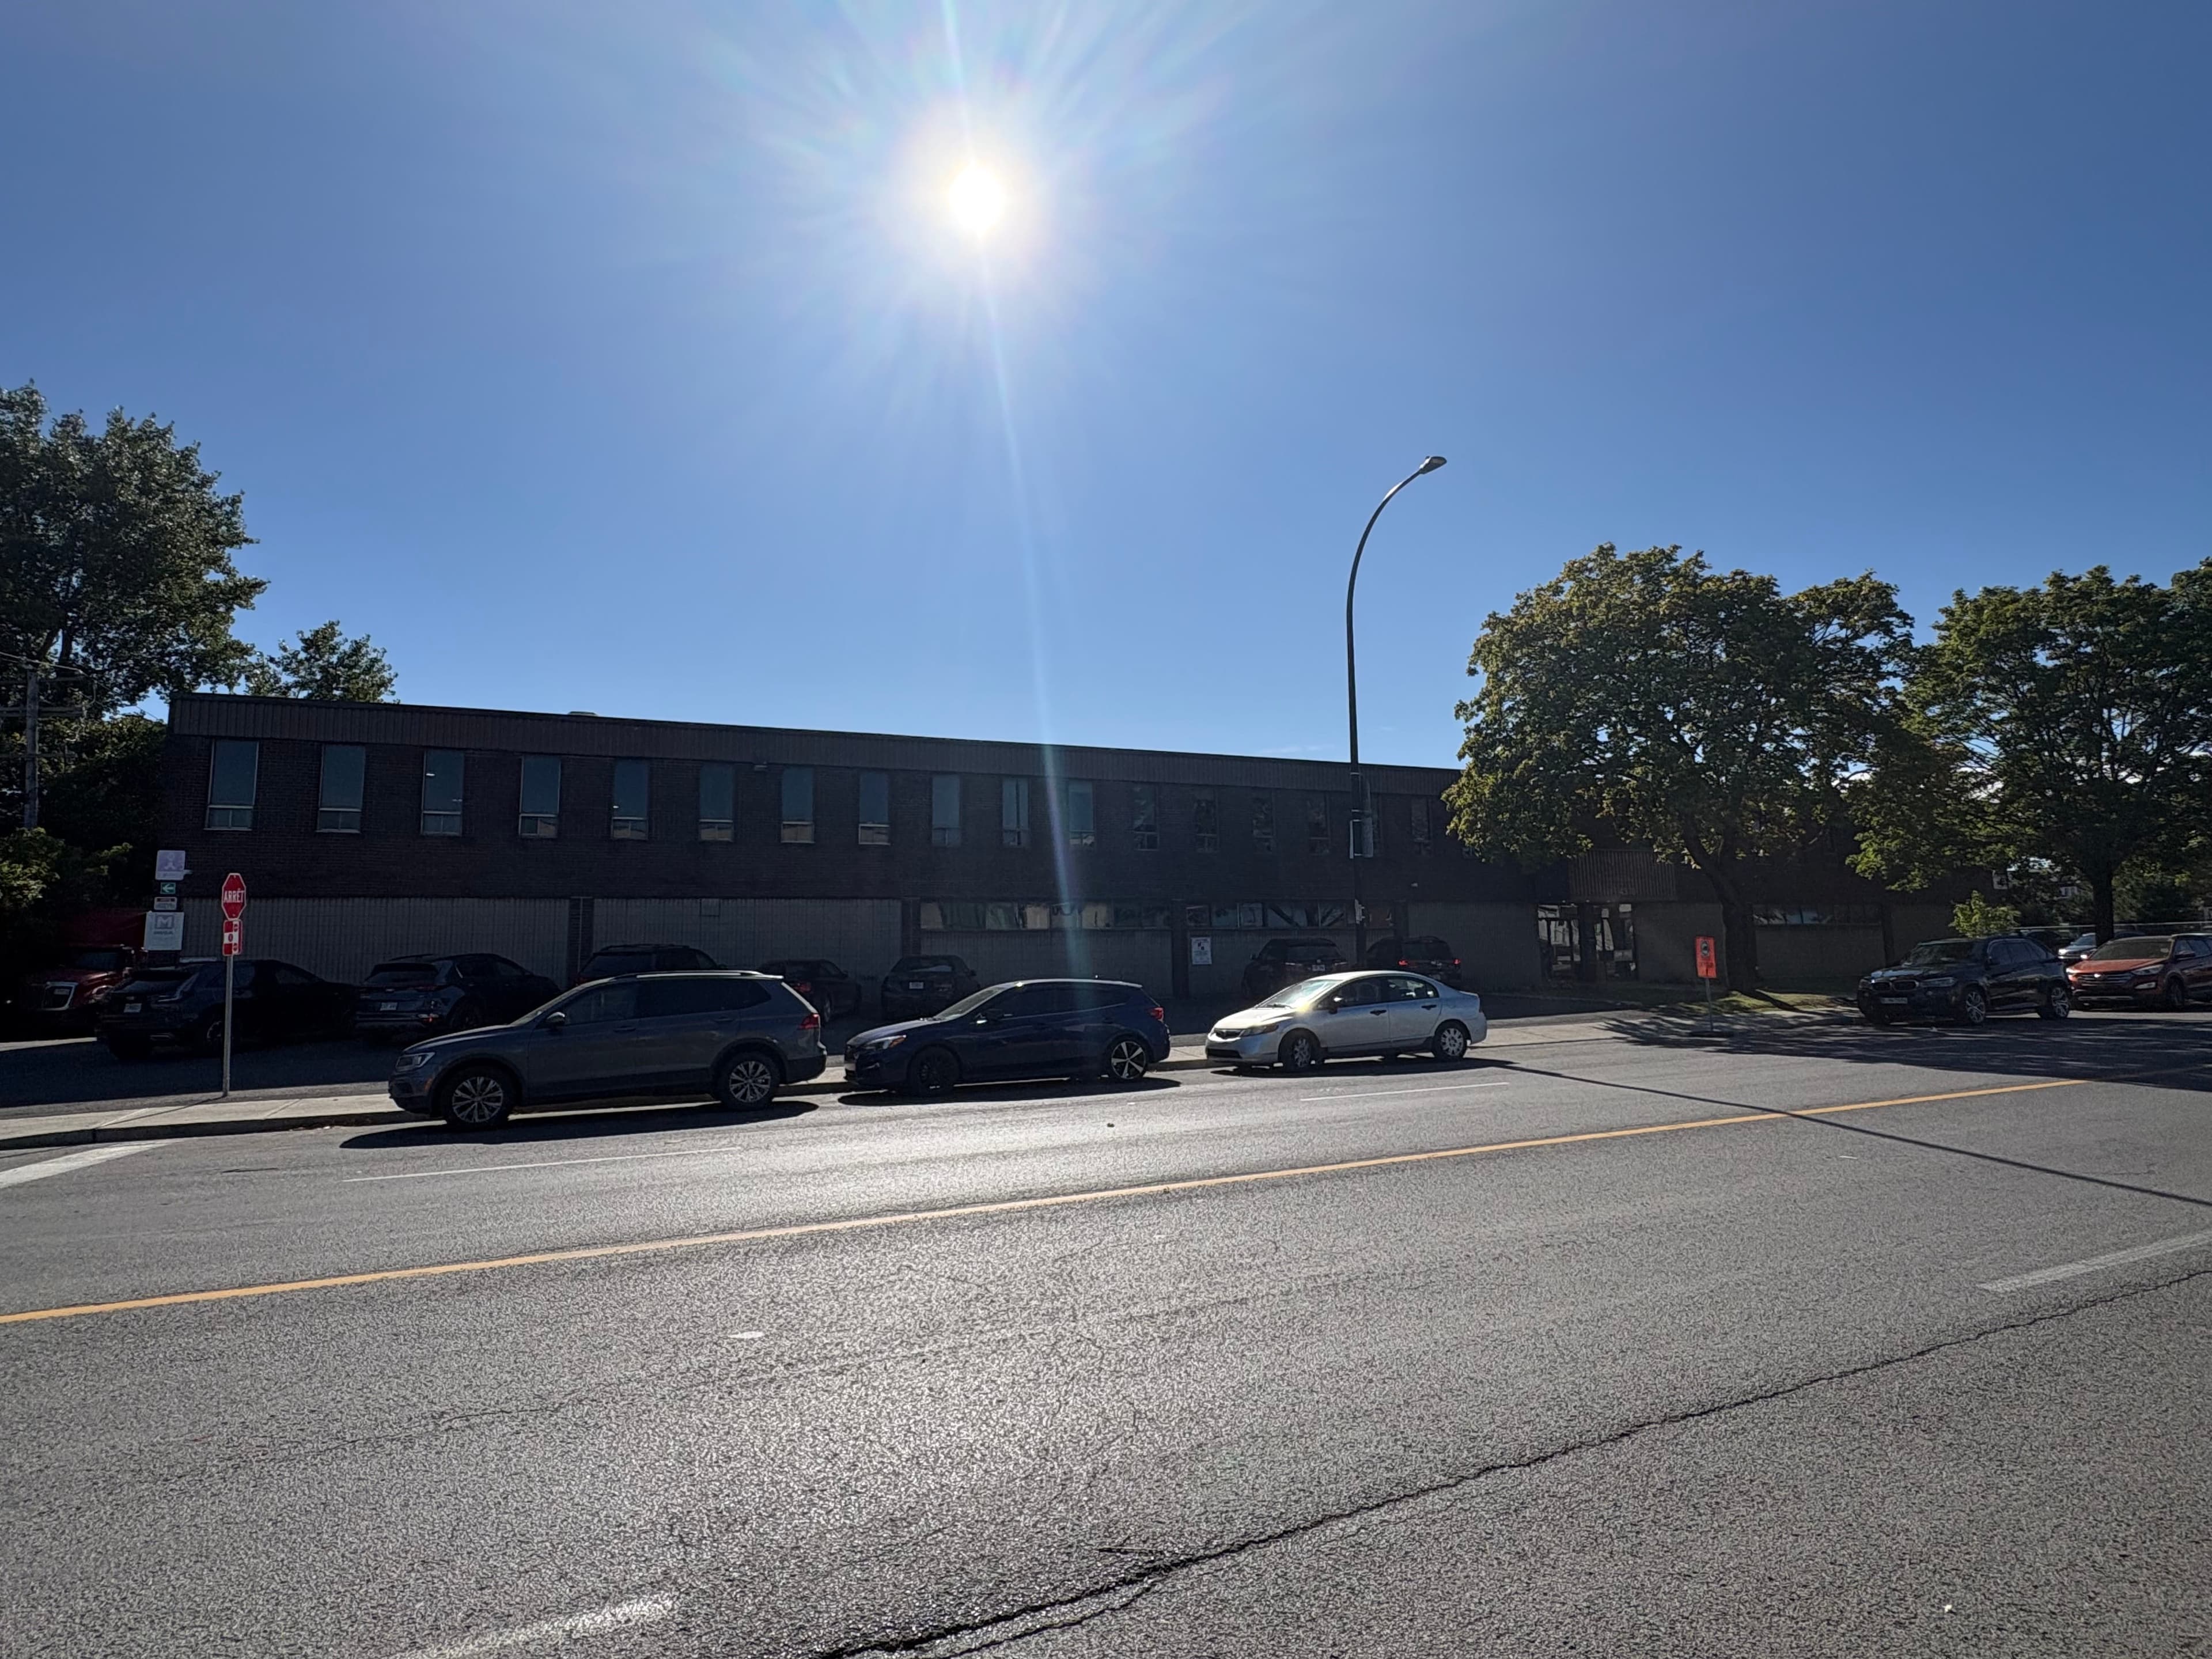
Greater Montreal Area: Industrial
4370-4378 des Grandes-Prairies Boulevard, Saint-Léonard
$11,765,000
$136 per sq. ft.
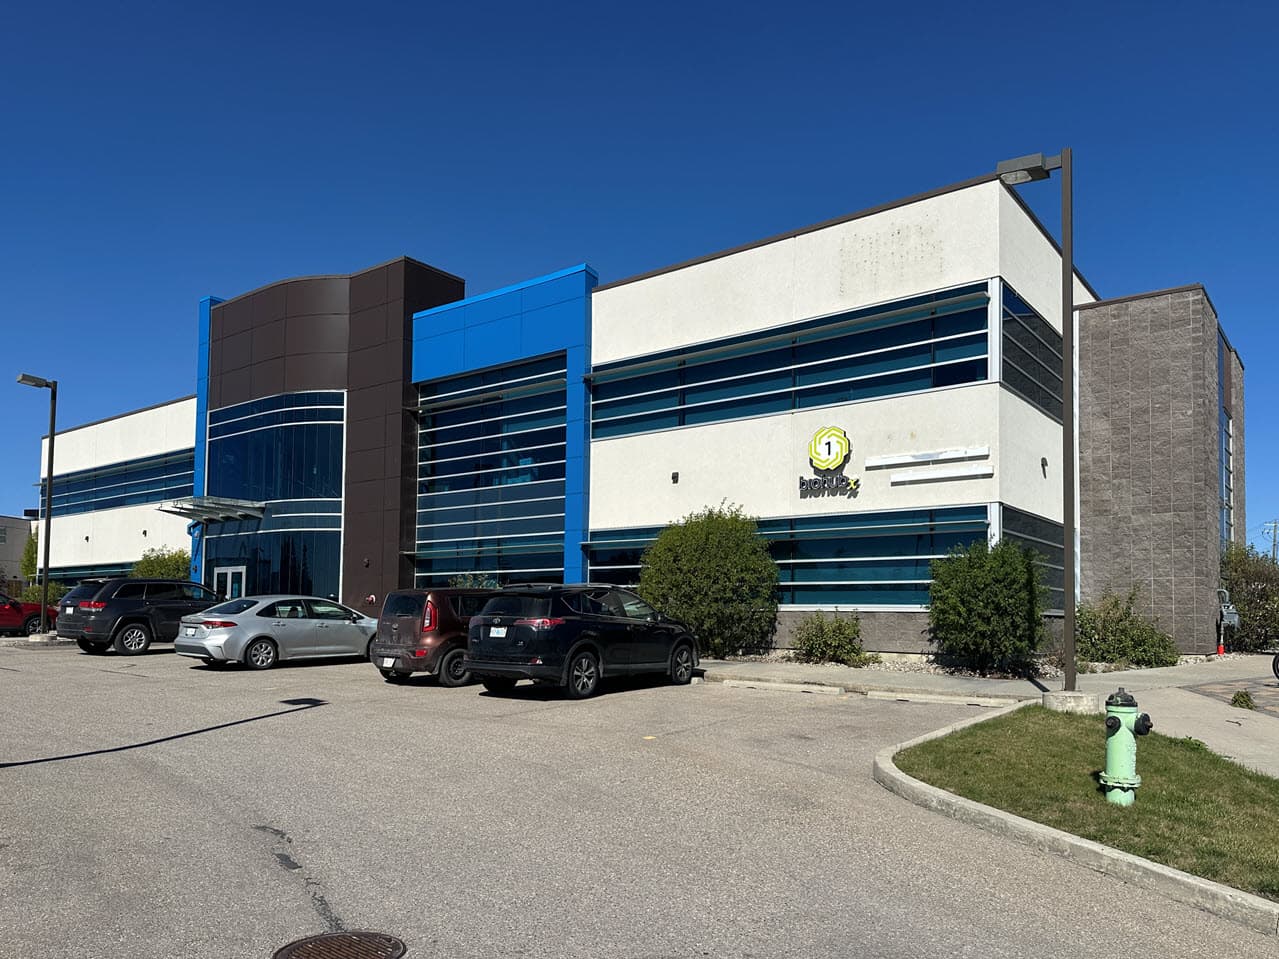
Greater Calgary Area: Office
32 Royal Vista Drive NW, Calgary
$6,000,000
$310 per sq. ft.
Greater Toronto Area
Sector | Municipality | Address | Price | Unit Price | Parameters | Brokers |
|---|---|---|---|---|---|---|
Apartment | Old Toronto | 634 Church Street | $54,395,274 | $555,054 | per unit | |
Retail | Scarborough | 1165 Kennedy Road | $11,375,000 | $376 | per sq. ft. | |
Industrial | Mississauga | 5640 Timberlea Boulevard | $9,870,000 | $329 | per sq. ft. | Evan S. White, Evan T. White, Phillip Cheung (CBRE) |
Greater Vancouver Area
Sector | Municipality | Address | Price | Unit Price | Parameters | Brokers |
|---|---|---|---|---|---|---|
Apartment | Vancouver | 8750 Osler Street | $9,700,000 | $255,263 | per unit | Megan Low, Kevin Murray, Carey Buntain, Chris Wieser (Avison Young) |
Industrial | Surrey | Unit 10-12, 12484 82nd Avenue | $4,200,000 | $820 | per sq. ft. | |
Industrial | Burnaby | 5508 Dorset Street | $3,600,000 | $420 | per sq. ft. | Sam Emam, Trideep Chakraborty (Paradigm Group) |
Greater Montreal Area
Sector | Municipality | Address | Price | Unit Price | Parameters | Brokers |
|---|---|---|---|---|---|---|
Office | Dollard-des-Ormeaux | 1855 Saint-Régis Boulevard | $3,950,000 | $162 | per sq. ft. | |
Industrial | Terrebonne | 3145-3155 Joseph-Monier Street | $3,850,000 | $340 | per sq. ft. | |
Apartment | Terrebonne | 1569-1579 Grande Allée | $2,125,000 | $354,167 | per unit | Joseph Perret, Marie-Hélène Chartier (Re/Max Action), Jean-Chrystophe Diotte (Royal LePage Habitations) |
Greater Calgary Area
Sector | Municipality | Address | Price | Unit Price | Parameters | Brokers |
|---|---|---|---|---|---|---|
Industrial | Calgary | 4839 90th Avenue SE | $5,165,000 | $278 | per sq. ft. | Luke Hamill (CBRE) |
Industrial | Calgary | 5938 Centre Street SE | $2,500,000 | $193 | per sq. ft. | |
Industrial | Calgary | Unit 114, 10300 68th Street SE | $2,133,540 | $286 | per sq. ft. | Evan Renwick, Luke Hamill (CBRE) |

Market Indicators
GTA low-rise new home sales top 10-year average for fifth straight month
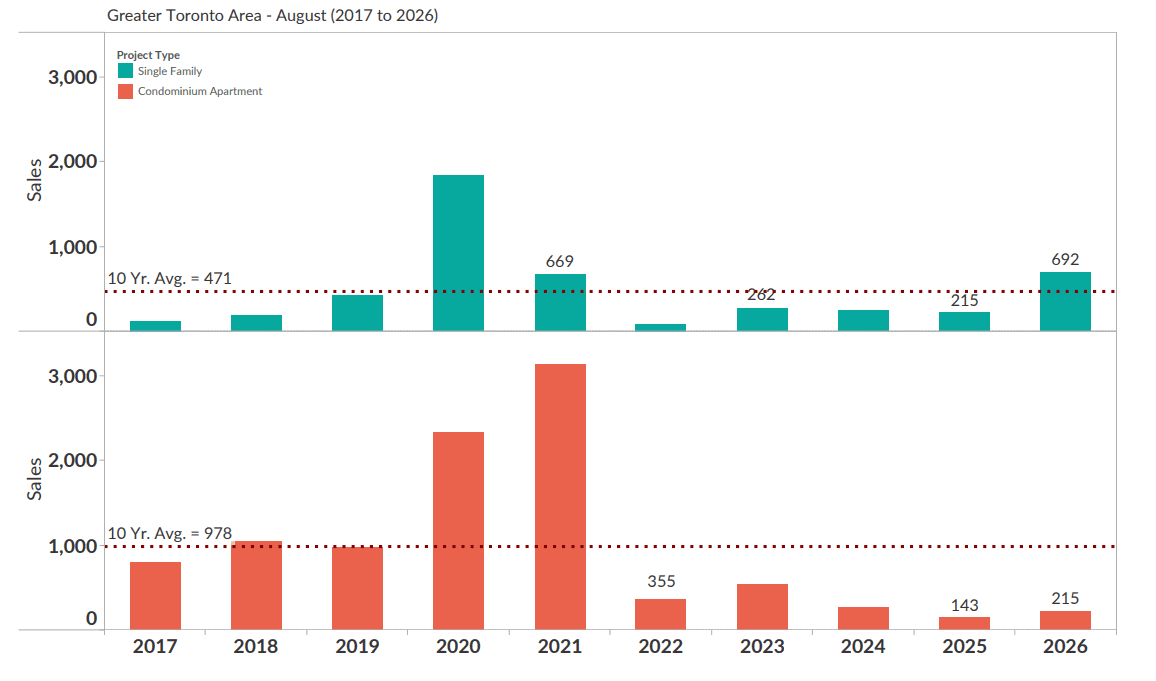
Last week, BILD released their New Homes Monthly Market Report for August 2026, powered by Altus data. GTA low-rise new home sales surpassed their 10-year average for a fifth consecutive month in August, driven by continued momentum from Ontario's HST rebate program. Single-family sales reached 692 units, 47% above the 10-year average. Condominium sales rose 50% year-over-year but remained 78% below the 10-year average, with the high-rise segment still struggling to fully participate in the rebate program.
Figure 1: August New Home Sales by Year & Project Type (BILD New Homes Report, Altus Group Data)
New single-family benchmark pricing down 14.6% YoY as inventory rises
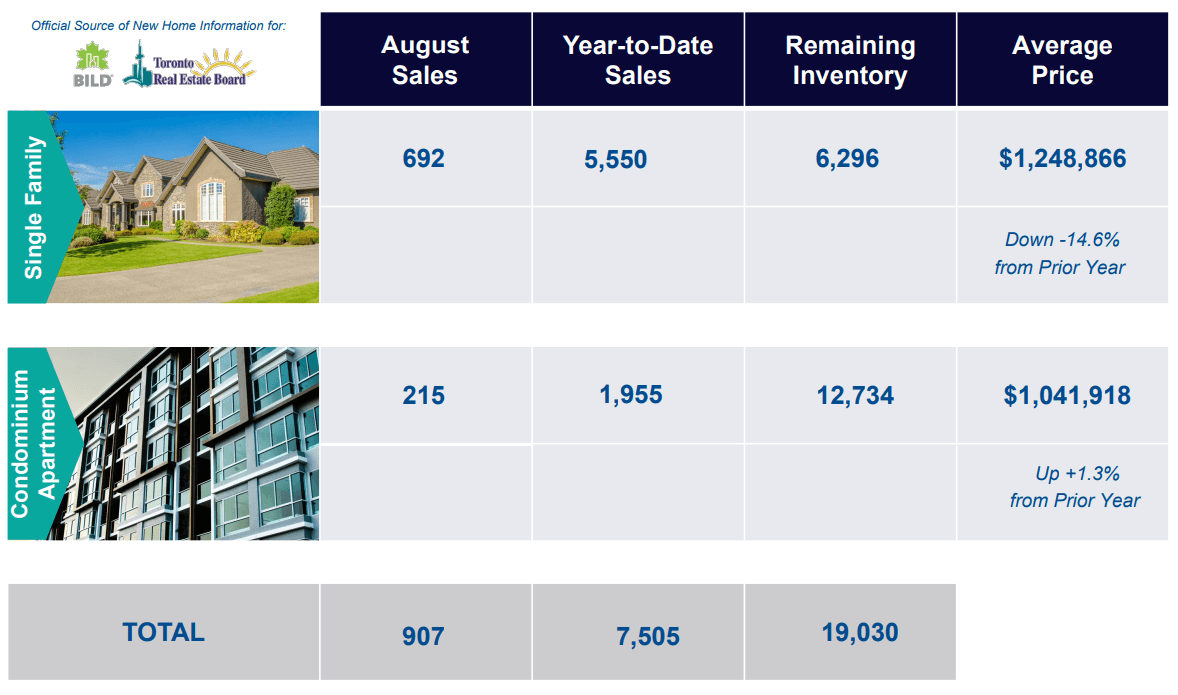
Another insight from BILD's latest report is that benchmark price for new single-family homes in the GTA fell 14.6% over the past 12 months to $1,248,866, while new condominium apartment pricing edged up 1.3% year-over-year to $1,041,918. Total remaining inventory rose to 19,030 units, representing 38.5 months of supply, as builders responded to increased sales with a steady flow of new product.
Figure 2: August 2026 GTA New Home Market Results (BILD New Homes Report, Altus Group Data)

INSIGHTS Spotlight
Catch the latest research and insights from Altus
Canadian CRE market update – Q2 2026
Total national investment volume for the first half of 2026, excluding the Alberta markets, reached $24.1 billion, supported by year-over-year increases of 67% in multi-family and 61% in office activity, with growth concentrated in the eastern markets. The full story covers investment trends and volume across sectors and regions, core drivers of resilience and performance, and the outlook for the rest of 2026.
About our research team

Edward Jegg
Research Manager, Data Solutions
Altus Group
Edward Jegg is a Research Manager, Data Solutions at Altus Group, with over 35 years of commercial real estate expertise. He delivers market intelligence across Canada, transforming complex data into actionable insights for investment decision-making. Edward is a recognized expert in real estate trends and recipient of BILD's Chair's Award of Merit.

Jennifer Nhieu
Senior Research Analyst, Data Solutions
Altus Group
Jennifer Nhieu is a Senior Research Analyst, Data Solutions with Altus Group, where she specializes in providing timely, data-driven insights into the Canadian market. Leveraging her background in CRE and geographic information science, Jennifer is a key contributor to Altus Group’s quarterly research insights. She transforms complex data sets into clear, actionable intelligence, helping stakeholders make informed decisions.
About the Data Solutions team
Behind every update in our newsletter is the work of our Data Solutions team, a group dedicated to keeping you informed on commercial real estate activity across Canada. From Vancouver to Toronto (and everywhere in between), they track transactions, visit properties, and add the local context that numbers alone can’t capture. Their work goes beyond deals, by providing insights into new home developments and sales trends, as well as detailed office and industrial inventory data across key markets, from Montreal and Calgary to Winnipeg, Quebec City, and Atlantic Canada.
Disclaimer: The opinions expressed in this newsletter are solely those of the authors and are not endorsed by Altus Group Limited, its affiliates and its related entities (collectively “Altus Group”). This publication has been prepared for general guidance on matters of interest only and does not constitute professional advice or services of Altus Group. You should not act upon the information contained in this publication without obtaining specific professional advice. No representation or warranty (express or implied) is given as to the accuracy, completeness or reliability of the information contained in this publication, or the suitability of the information for a particular purpose. To the extent permitted by law, Altus Group does not accept or assume any liability, responsibility or duty of care for any consequences of you or anyone else acting, or refraining to act, in reliance on the information contained in this publication or for any decision based on it. The distribution of this publication to you does not create, extend or revive a client relationship between Altus Group and you or any other person or entity. This publication, or any part thereof, may not be reproduced or distributed in any form for any purpose without the express written consent of Altus Group.
Resources
Latest insights