Canadian CRE investment trends
Q3 2023: Investors have pivoted to stable, low-risk areas of real estate - supported by strong underlying demographic and economic fundamentals.

Key highlights
Canada’s Overall Capitalization Rate (OCR) rose slightly to 5.77% in Q3 2023 compared to the previous quarter at 5.62%
Since the start of 2023, employment has grown by 30,000 per month on average; however, Statistics Canada estimates employment gains of 50,000 per month are needed to keep pace with population growth
Job seekers appear to be experiencing difficulties finding employment, and holding multiple jobs to afford essential needs
The industrial and multi-family sectors continued to be favoured by investors as both were supported by strong underlying demographic and economic fundamentals
The top three preferred Canadian markets for investors across all asset classes were Halifax, Toronto and Ottawa
The top three preferred property types by investors in the third quarter of 2023 were food-anchored retail strip, suburban multiple unit residential and multi-tenant industrial
Elevated interest rates and financing difficulties have led investors toward low-risk assets and stable returns, such as residential, industrial and food-anchored retail
A positive outlook remains for Canada's industrial and multi-family sectors despite the lingering effects of higher interest rates and borrowing costs
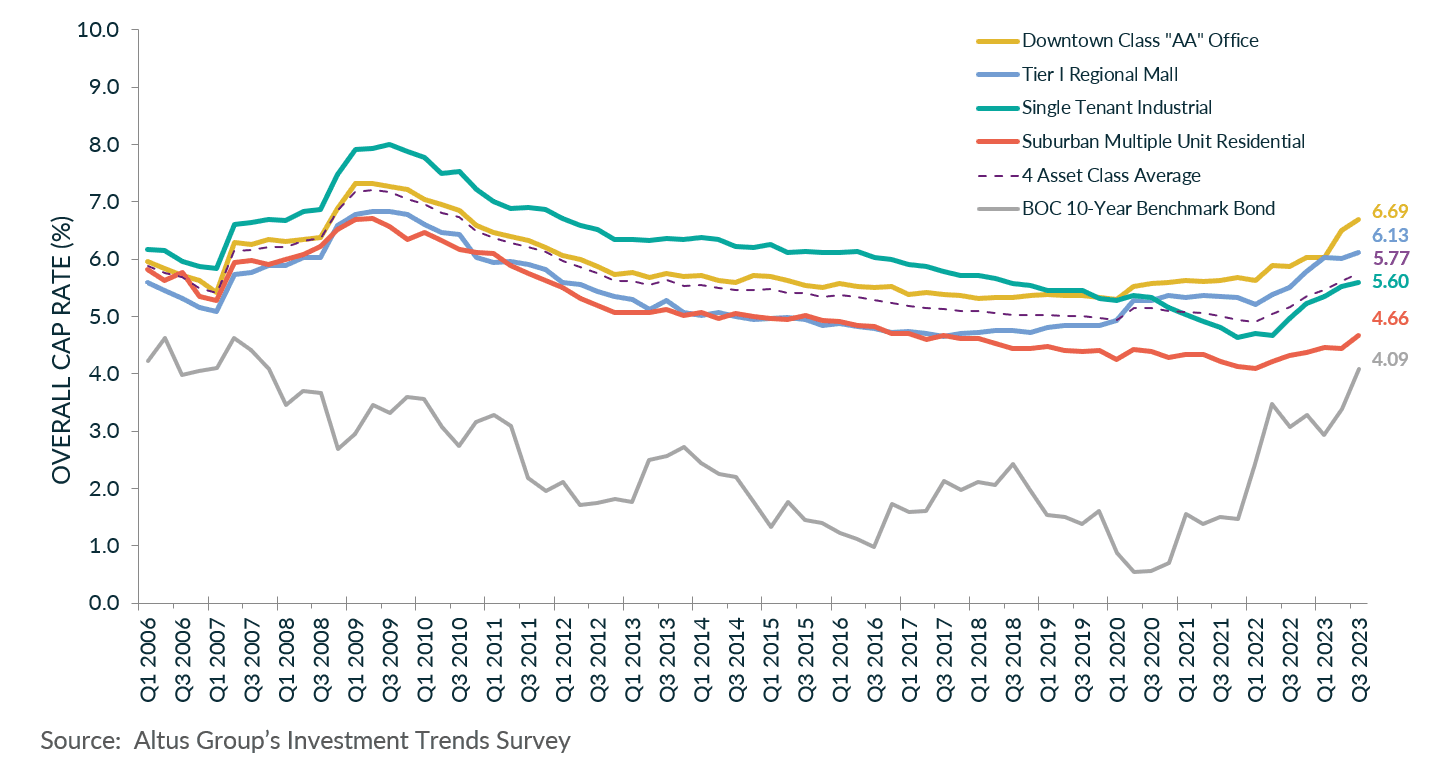
The latest results from Altus Group’s Canadian Investment Trends Survey (ITS) for the four benchmark asset classes show that the Overall Capitalization Rate (OCR) rose slightly to 5.77% in Q3 2023 compared to the previous quarter at 5.62% (Figure 1).
According to Statistics Canada’s Labour Force Survey (LFS), the labour market showed renewed buoyancy. As of September 2023, employment rose by 64,000 (0.3%), with the unemployment rate unchanged at 5.5%. This increase was insufficient to absorb all the new entrants into the labour market. Since the start of 2023, employment has grown by 30,000 per month on average. However, Statistics Canada estimates employment gains of 50,000 per month are needed to keep pace with population growth. Moreover, gains in employment were noted in educational services and transportation and warehousing. Meanwhile, losses in employment were noted in finance, insurance, real estate, rental and leasing, construction; and in information, culture, and recreation. Furthermore, Statistics Canada reported that a greater proportion of Canadians remained unemployed for longer, and more were working multiple jobs year-over-year. These trends suggest job seekers were experiencing difficulties finding employment, and needed multiple jobs to afford essential needs (e.g., groceries, clothing, transportation, and mortgage or rental payments).
The Bank of Canada bond rate, as of September 23, 2023, was recorded at 4.09%, increasing by 87 bps since the end of Q2 2023. As the Bank of Canada focused on inflationary control measures, the average OCR rates increased to 5.77%. Cap rates have increased, but not uniformly across asset classes. Amidst the unfavourable economic conditions, a pullback in activity and a rise in cap rates was unavoidable. However, the industrial and multi-family sectors continued to be favoured by investors as both were supported by strong underlying demographic and economic fundamentals.
Figure 1 - National markets - OCR trends for four benchmark asset classes
Commercial investment activity
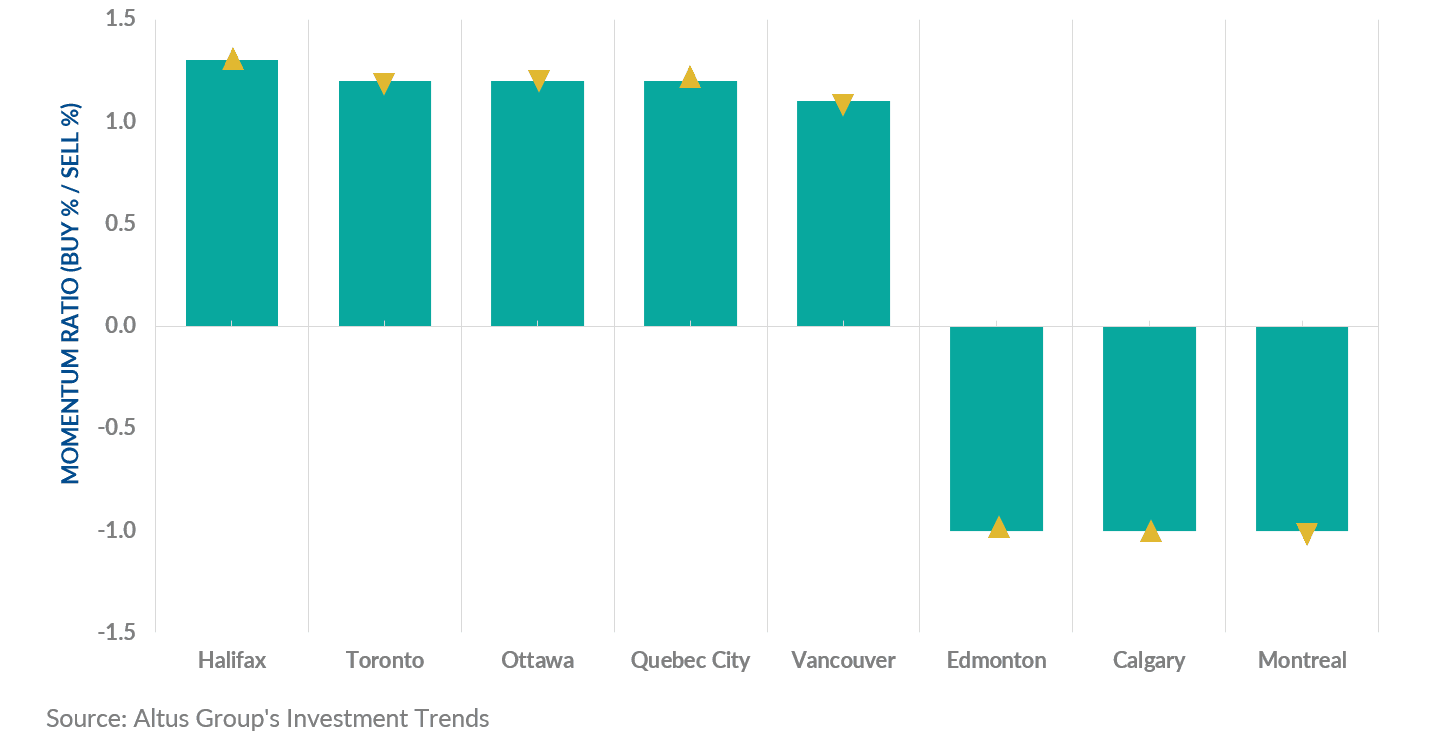
The high cost of financing and tightened lending practices for certain assets further dampened investor activity in the third quarter. The bid-ask spread between buyers and sellers and further geopolitical uncertainty continues to delay, if not stop, certain transactions. The top three preferred markets for investors across all asset classes were Halifax, Toronto and Ottawa, respectively (Figure 2). Halifax climbed by five places to the top spot as the top preferred market in Q3 2023, while Toronto remained second. The location barometer reported a mixed trend in the momentum ratio (percentage of investors looking to buy vs. percentage of investors looking to sell) across all markets compared to the previous quarter, which reported a mostly downward momentum. Halifax, the most preferred location, along with Quebec City, Edmonton and Calgary, reported an upward momentum, while Toronto, Ottawa, Vancouver and Montreal all reported a downward momentum.
Figure 2 - Location barometer - All available products (Q3 2023)
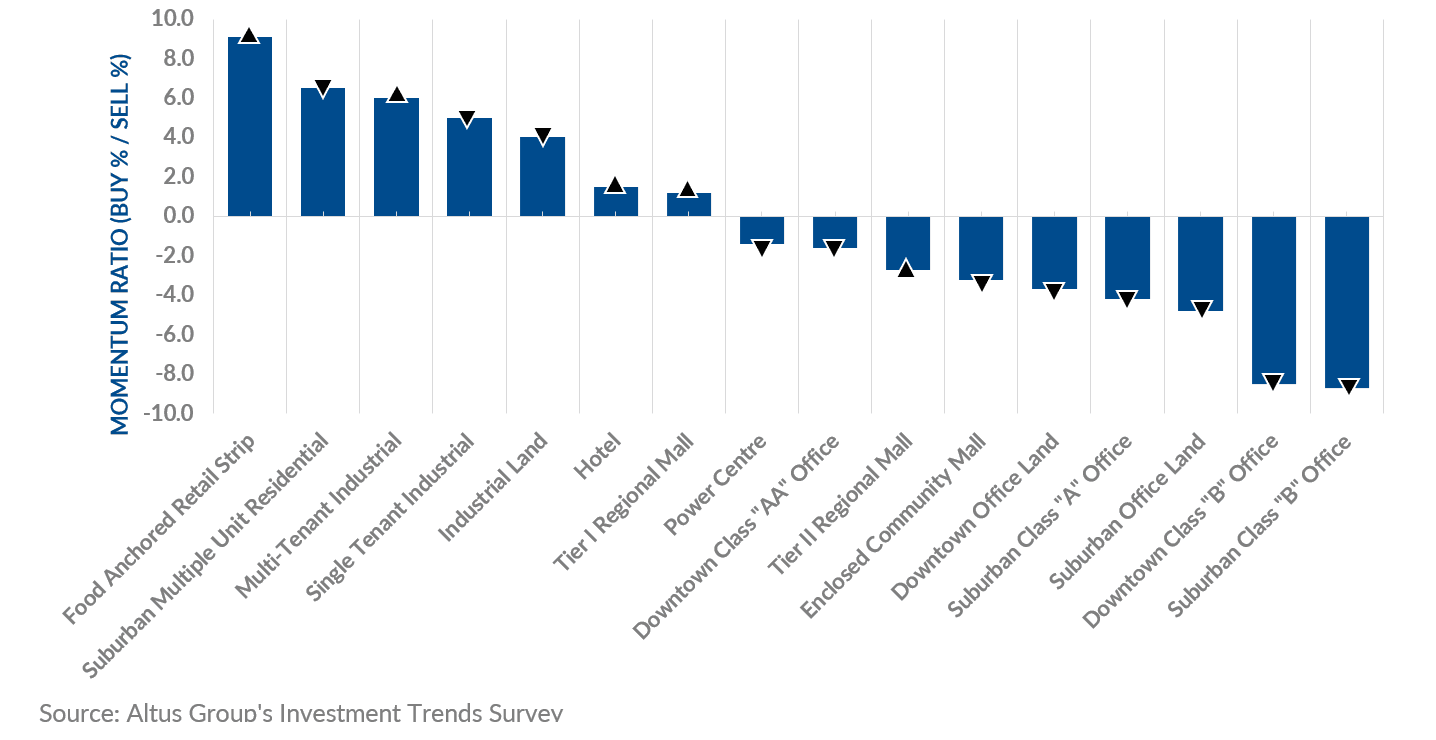
The top three preferred property types by investors in the third quarter of 2023 were food anchored retail strip, suburban multiple unit residential and multi-tenant industrial, respectively (Figure 3). As Canadians spent more time at home, primarily due to the hybrid work model, neighbourhood and community-level retail allowed consumers to shop locally and grocery stores to thrive as spending was shifted to essential goods. Moreover, food anchored retail strip and multi-tenant industrial reported an increase in momentum ratio, while suburban multiple-unit residential reported a decrease. Furthermore, all office-type assets had a negative momentum ratio with continued concerns around elevated availability rates.
Figure 3 - Property type barometer - All available products (Q3 2023)
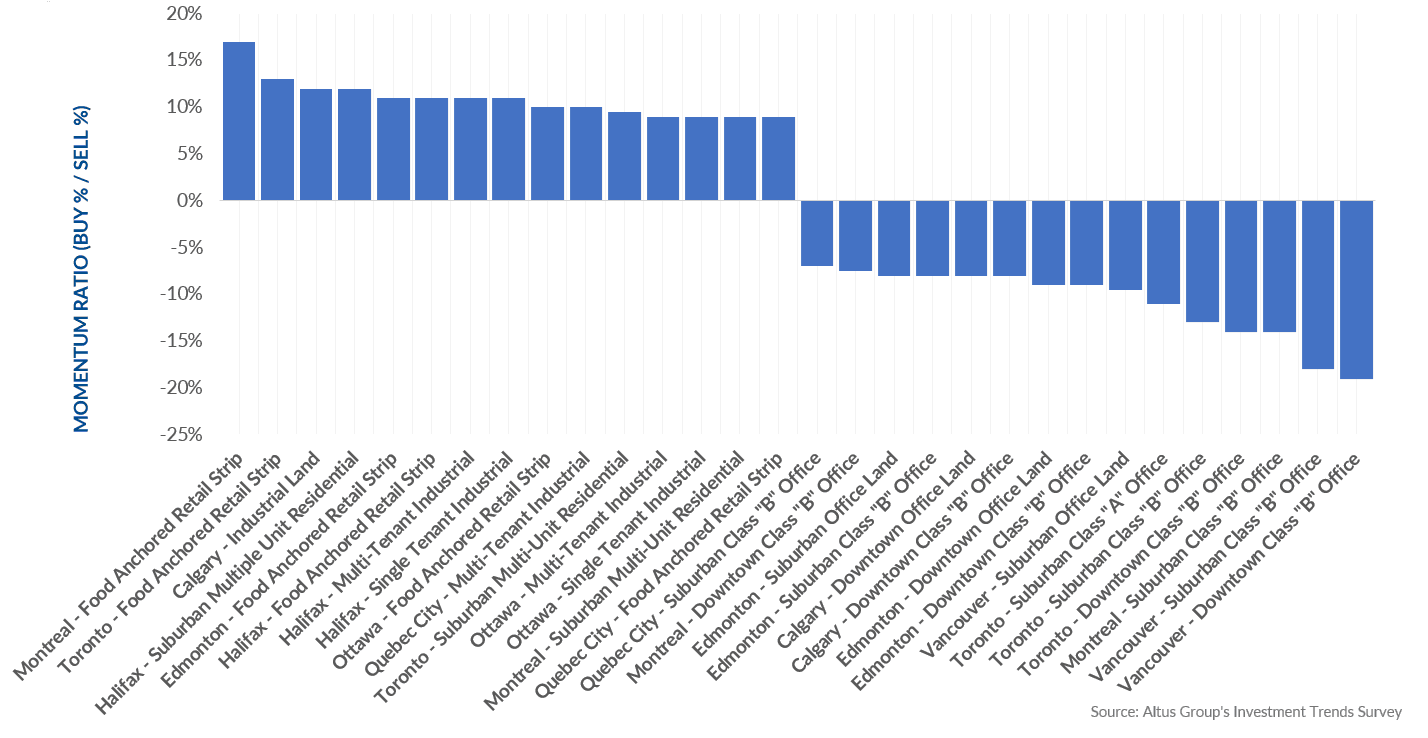
According to the Product/Market barometer, the top three preferred combinations (Figure 4) were Montreal – food anchored retail strip, Toronto – food anchored retail strip and Calgary – industrial land. The 15 least preferred combinations all revolve around the office asset. Elevated interest rates and financing difficulties have led investors toward low-risk assets and stable returns, such as residential, industrial and food-anchored retail.
Figure 4 - Product/Market barometer - All available products (Q3 2023) – Top 15 preferred/least preferred
Market highlights for the quarter include:
Cap rates for suburban multiple unit residential increased to 4.66%. The suburban multiple-unit residential cap rate increased by 0.22 % quarter-over-year, with all major markets observing an increase. Quebec City recorded the highest increase of 0.5% to 5.3%.
Cap rates for single-tenant industrial increased to 5.60%. The national industrial availability rate increased to 3.6%. Cap rates across all markets, apart from Quebec City and Ottawa, experienced an increase quarter-over-quarter.
Downtown class “AA” office cap rates increased from the previous quarter to 6.69%. The national office availability rate began to flatten at 17.6%. This also marks the third consecutive quarter of negative net absorption. All markets experienced an increase in cap rates quarter-over-quarter except for Vancouver and Quebec City.
Tier 1 regional mall cap rates increased slightly to 6.13%. Cap rates were mixed across the major markets – Edmonton, Calgary, Toronto, Ottawa, and Halifax experienced upward pressure. At the same time, compression occurred in Vancouver and Montreal, and Quebec City experienced no change.
Other highlights include:
Of the 128 combinations of products and markets covered in the Investment Trends Survey for Q3 2023:
55 had a “positive” momentum ratio (i.e., a higher percentage of respondents said they were more likely to be a buyer than a seller in that particular segment), the same as reported in Q2 2023; 73 had a “negative” momentum ratio, also the same as reported in Q2 2023.
The top 15 products/markets which showed the most positive momentum were:
Calgary – Industrial land
Toronto – Food-anchored retail strip and suburban multiple unit residential
Ottawa – Food-anchored retail strip, multi-tenant industrial and single-tenant industrial
Montreal – Food-anchored retail strip and suburban multiple unit residential
Quebec City – Multi-tenant industrial and food-anchored retail strip
Halifax – Suburban multiple unit residential, food-anchored retail strip, multi-tenant industrial, and single-tenant industrial
Edmonton – Food-anchored retail strip
Author

Jennifer Nhieu
Senior Research Analyst
Author
Jennifer Nhieu
Senior Research Analyst
Resources
Latest insights