Key highlights
With the most recent inflation figure (September’s headline CPI was 8.2%) still well above the Fed’s target range of 2%, many are considering what higher rates for longer will mean for business and investment
Looking at quarterly CRE transaction data back to 1980s, history suggests that higher interest rates lead to fewer transactions, softer pricing, and a rise in distress sales
While distress sales may rise, the current CRE sector is generally healthy with no obvious signs of industry-wide excessive over-leverage; as a result it is unlikely that higher interest rates alone would cause distress and rise to similar levels as seen following the S&L Crisis or GFC
As the US Federal Reserve (“Fed”) continues its 2022 rate hikes to cool the economy and get inflation under control, the cost of doing business continues to increase. With the most recent inflation figure (September’s headline CPI was 8.2%) still well above the Fed’s target range of 2%, many are considering what higher rates, for a prolonged of period of time, will mean for business and investment.
For many businesses, these higher financing costs likely mean slower growth and expansion plans. For many investors, these higher financing costs will likely weigh on expected returns.
What do higher interest rates mean for commercial real estate (CRE)? While nobody has a crystal ball, looking at the historical record provides some color on what may play out in the coming quarters. Using our Reonomy data, we looked at quarterly CRE transaction activity and pricing back through the 1980s.
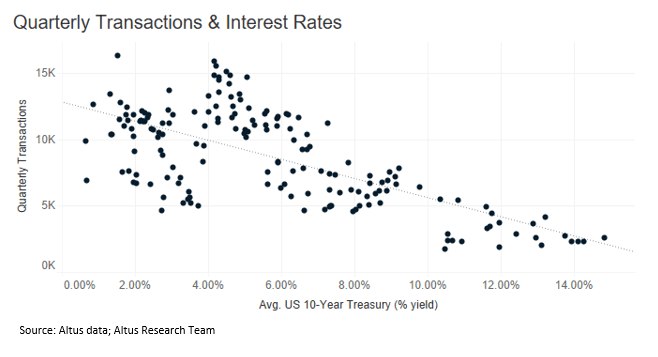
History shows that higher interest rates are negatively correlated with deal activity (R-squared=0.47); as interest rates increase, deal activity tends to fall. This seems logical, as a higher cost of financing often makes return hurdles more difficult to hit.
Figure 1 - Quarterly transactions and interest prices

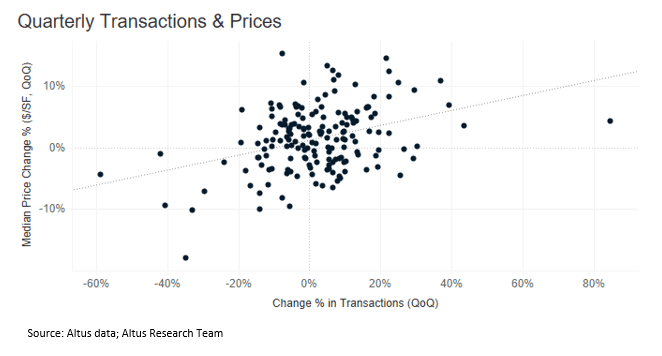
History also shows that transaction activity is positively correlated (albeit weakly) with CRE prices (R-squared=0.13); as transaction activity declines, prices also tend to decline.
Figure 2 - Quarterly transactions and prices

Putting these observations together, suggests that higher interest rates, means fewer transactions and lower prices. With fewer transactions occurring and prices softening, distressed CRE sales (i.e., tracked here by foreclosure sales) as a percentage of total transaction activity, tends to increase. This pattern of softening prices preceding a spike in distress sales is seen back through the 1980s.
Figure 3 - Distressed Transactions and Prices

Camel humps: While distress sales rose following price declines, the Savings and Loan Crisis (“S&L Crisis”) of the early 1990s and the Global Financial Crisis (“GFC”) of the late 2000s, saw significantly higher levels of distress sales because real estate played a much more significant central role in these crises.
The current CRE sector is generally healthy and there are no obvious signs of industry-wide excessive over-leverage. As a result, it is unlikely that higher interest rates alone would cause distress to rise to similar levels as seen following the S&L Crisis or GFC. While the credit conditions across US CRE continue to perform and show stability, prolonged higher rates may lead to more distress, as both tenant finances and property cash flows come under stress and exit opportunities dry up (e.g., sales or refinancing to lower rate).
Turning this insight into action
For investors with capital, distress sales present opportunities to acquire assets at discounted prices. Monitoring overall levels of distress within the market and identifying assets of interest are important steps for investors to be able to act quickly and with confidence when the time comes.
The best investors tend to monitor the current situation at both the broad market level and individual asset level.
At the broad market level, distressed CRE investors will often track delinquency trends across CMBS and bank portfolios, along with corporate credit events and default rates. Large tenant downsizing announcements, such as store closures are also important to monitor.
Complementing the high-level monitoring, CRE investors looking to create an opportunity from elevated levels of distress will also do monitoring and due diligence at the individual asset level. Monitoring Watchlist commentary (for CMBS loans only), upcoming debt maturity dates, pre-foreclosure court filings (e.g., notice of default, lis pendens, final judgement of foreclosure), and auction dates are often ongoing activities.
Whether you are monitoring high-level market trends or following specific properties, Reonomy provides valuable through-the-cycle property intelligence. Learn more about how Reonomy can help with your CRE decisions.
Author

Omar Eltorai
Senior Director of Research, Altus Group
Author

Omar Eltorai
Senior Director of Research, Altus Group
Resources
Latest insights


