Key takeaways
The Manufacturing PMI measures aspects such as new orders, inventory levels, output, supplier deliveries, and employment, providing a comprehensive view of the manufacturing sector's health and trajectory
Understanding the PMI and its components is essential for correlating it with industrial real estate demand data such as occupancy rates, absorption, and new leases
It's important to integrate the PMI with broader economic indicators and historical industrial property demand data to gain a comprehensive understanding of market trends
Regional factors and trade relationships can significantly impact industrial real estate demand, highlighting the need to consider geographical nuances in investment decisions
Understanding the Manufacturing PMI
The US Manufacturing Purchasing Managers’ Index (PMI), provided by S&P Global, is a useful economic indicator for aiding investment decision-making for the US industrial real estate market. Several data points within the PMI can provide real estate investors a sense of the health and trajectory of the US manufacturing industry, and by extension what level of demand there could be for different industrial properties like distribution centers, warehouses, and manufacturing facilities.
In this article, we’ll discuss what types of data are available in the Manufacturing PMI, how it connects with industrial real estate demand, and ways the Manufacturing PMI can be tied together with other economic indicators. We’ll also provide examples of strategies that can be influenced by Manufacturing PMI and what tools are available for helping to monitor this important index.
Tying Manufacturing PMI to industrial real estate demand
The US Manufacturing PMI is a monthly survey of purchasing managers across 800 manufacturers, measuring several aspects of manufacturing:
New orders – a measure of new orders received by manufacturers
Inventory levels – a measure of goods stored by manufacturers
Output – a measure of production activity
Supplier deliveries – a measure of materials needed for producing goods
Employment – a measure of staffing at manufacturing facilities
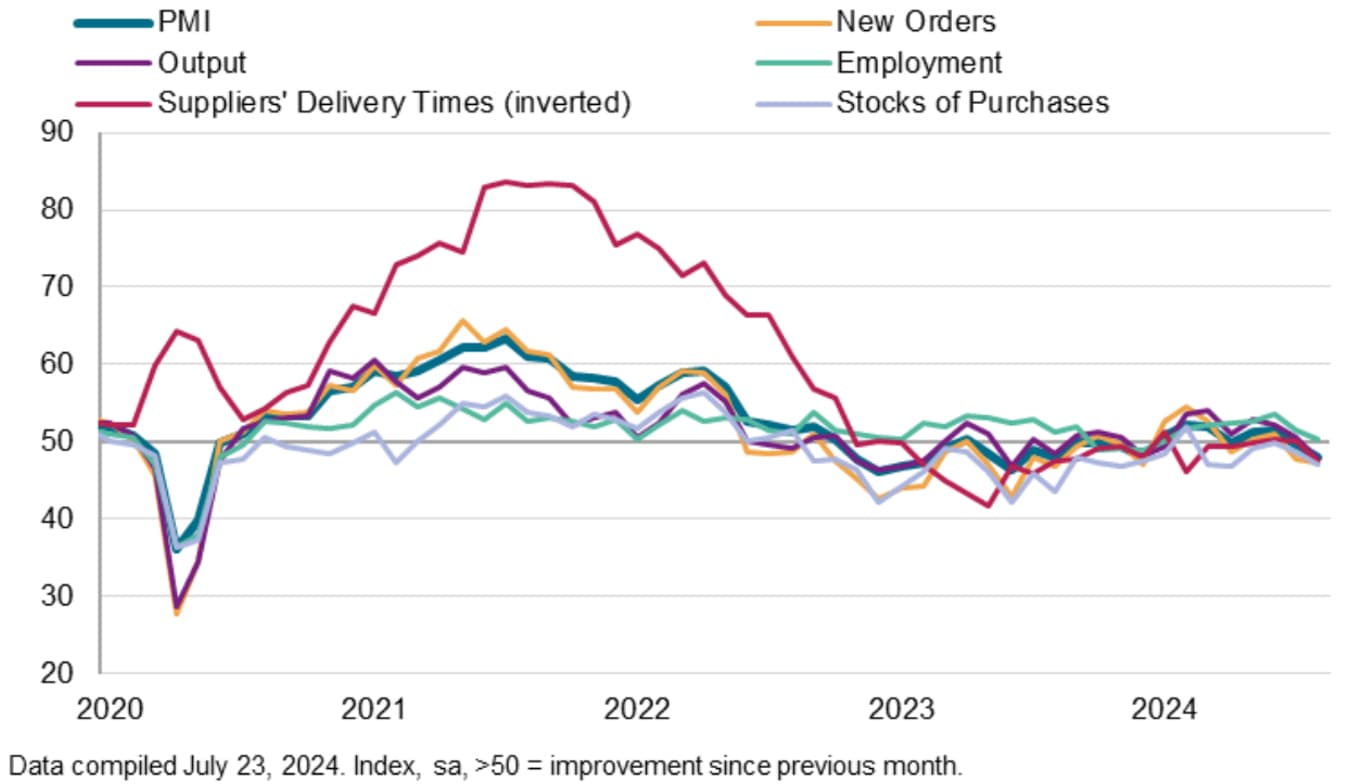
Responses across these five aspects create a composite score which is measured using a 0-100 scale. A composite index score above 50 means the manufacturing sector is growing, a score below 50 means the sector is shrinking, and a score of 50 means the sector is neither expanding nor contracting. Like the Manufacturing PMI composite score, the five aspects or components of the Manufacturing PMI are also measured on the same scale. Figure 1 shows a time series chart from S&P Global for US Manufacturing PMI and the five components contributing to its composite score.
Figure 1 - US Manufacturing PMI and its components (Source: S&P Global PMI)

The latest reading on this chart shows that all five components of the Manufacturing PMI fell from the prior month, with only employment remaining in growth territory. Overall, the Manufacturing PMI composite score is 48.0 in the August reading, down from 49.6 in July. This is the second consecutive month in which the sector has shown contraction.
Understanding how to read the Manufacturing PMI is only part of the puzzle, it’s important to look at these readings in parallel with historical industrial property demand data such as occupancy/vacancy rates, absorption, and new leases, to identify patterns or correlations. One example of a connection between these two sets of data could be an increase in inventory levels, which may precede increased demand for warehouses. Another example is an increase in supplier deliveries, which could precede increased demand for distribution centers or other third-party logistics properties.
Integrating PMI with broader economic indicators
Keep in mind that there is nuance in drawing a direct correlation between Manufacturing PMI and industrial real estate demand. Depending on the trending indicator from the Manufacturing PMI there may be a lag between what the survey states and how that eventually translates to industrial demand. Further, industrial demand may be concentrated in certain geographical regions or is most prominent for certain types of goods. This is why it is also important to pair Manufacturing PMI with other economic indicators such as e-commerce sales and national freight shipments, and where possible, regional manufacturing index data.
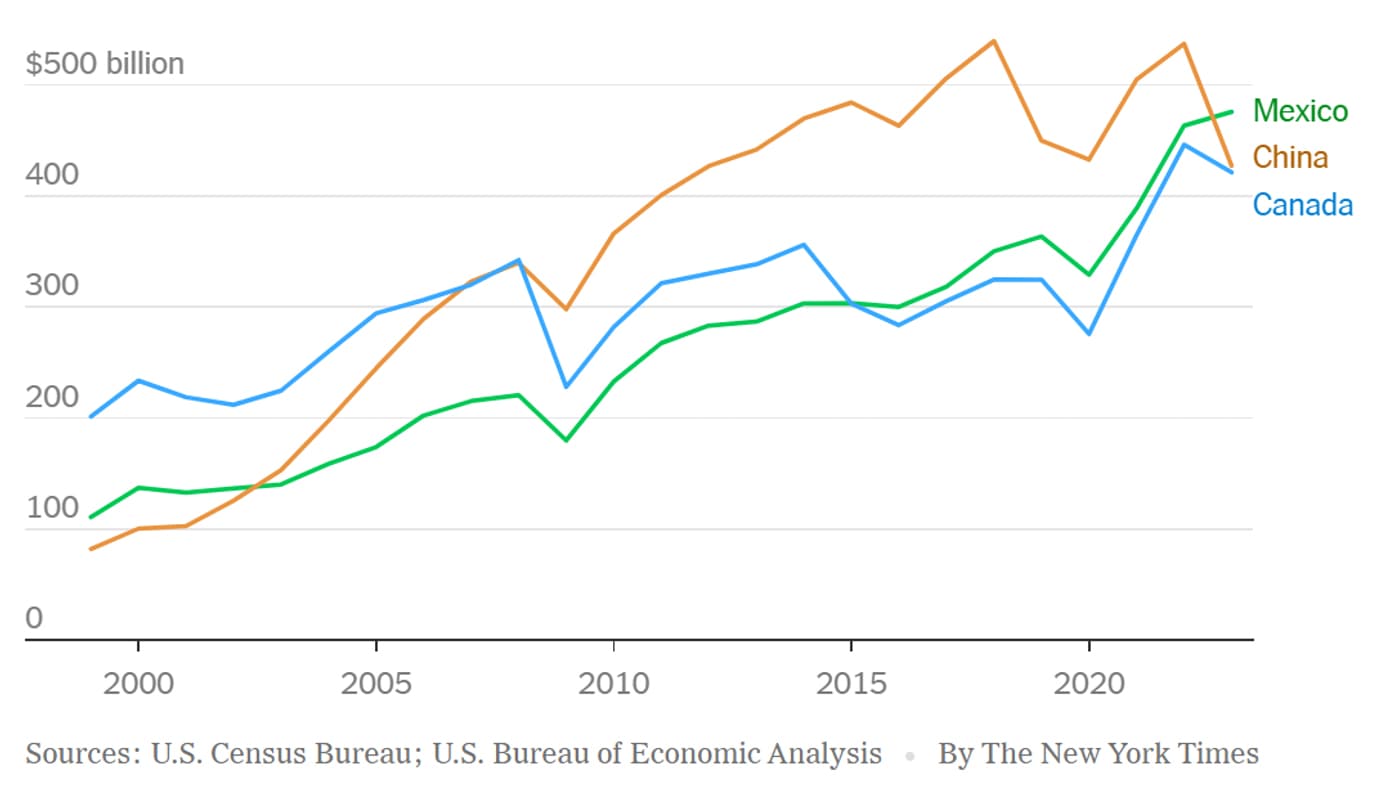
Take, for example, the Dallas-Fort Worth (DFW) industrial market. Mexico’s strong trade relationship with the US has grown especially fast over the last few years. As of 2024, the US now purchases more goods from Mexico than it does China, and one of the primary distribution arteries for imports from Mexico to the US runs through the DFW Metroplex.
Figure 2 - US import goods - China, Mexico, Canada (Source - NYTimes.com – For first time in two decades, US buys more from Mexico than China)

If reliance on imports of raw materials continues to shift towards Mexico, this may correlate with an increase on the Dallas-focused manufacturing index, positively impacting several or all components of the index (Note: the scale works a bit different compared to the Manufacturing PMI, instead of 50 being the neutral point for performance, the Federal Reserve-derived performance index uses zero as the baseline). The increasing index scores could precede increased demand for manufacturing facilities, warehouses, and logistics centers as DFW ramps up to handle an increased flow of imports, and additional US companies setup manufacturing operations just across the border from a leading foreign supplier.
Overlaying these additional sets of data on top of the original correlations identified between Manufacturing PMI and industrial real estate demand can help drive earlier and more accurate predictions on which industrial properties may become the next hot item in specific markets.
Monitoring Manufacturing PMI and timing your investments
Like our original example of the Manufacturing PMI, trends can go both ways, but so can your investment strategies. Rising Manufacturing PMI could mean it’s the right time to acquire industrial properties in a certain area, declining Manufacturing PMI may mean it’s time to divest from certain industrial properties in your portfolio or hold off on new acquisitions.
So much of what sound investing comes down to is good timing, and an important component of good timing is regularly keeping up to date with the latest releases of economic indicators and analyzing them against real estate market data. The Manufacturing PMI is released monthly in national, global, and regional form from a number of different sources. S&P Global is specifically a great source for national Manufacturing PMI and offers this index for many other countries. Another good resource for seeing many of the other related manufacturing index variations is Trading Economics, not only do they aggregate this data in one place, they also make it relatively easy to navigate between the variants.
Expand your toolset for industrial real estate investments
Investors can make more informed decisions by understanding the various components of the Manufacturing PMI, and their impact on industrial property demand. By monitoring the Manufacturing PMI in concert with industrial real estate market data, and other relevant economic indicators, investors can stay ahead of market shifts and better identify potential opportunities or risks. Consider the Manufacturing PMI and other economic indicators to support your next investment decision, and stay informed about the latest developments that could impact the industrial real estate market.
Interested in economic indicators that can help inform your investment decision in other commercial real estate asset types? Visit our Commercial Real Estate Economic Indicators resource page.
Want to be notified of our new and relevant CRE content, articles and events?
Author

Cole Perry
Associate Director of Research, Altus Group
Author

Cole Perry
Associate Director of Research, Altus Group
Resources
Latest insights


