Key highlights
Taking stock of the first six months of 2023, the global economy showed resilience in the face of ongoing substantial monetary tightening; though more tightening to come for many national economies, including the US
Many asset classes have seen positive gains over the last six months, recovering some of the recent ground lost, as many market outlooks are revised to push the anticipated recession risk out to 2024, if it does, in fact, occur
The outlook for commercial real estate (CRE) remains challenged, with concerns regarding recapitalization risk amidst a higher-for-longer rate environment
US CRE appears to be entering the next phase of its own credit cycle, with distress to be a key theme for the second half of 2023 and 2024
As we close out the first half of 2023, it’s a good time to reflect on what proved to be a very eventful six months – and take stock of where we are now as we set our sights on the latter half of the year.
Better than expected, but concerns remain
The global economy has largely beaten expectations set during the end of 2022. Overall growth across major economies has proven more robust than anticipated coming into the year, allaying fears of a sharp 2023 recession, and contributing to the partial bounce back of many major equity indices year-to-date. With mid-year outlooks now rolling out, many economists and portfolio strategists are moderating their initial recession concerns and revising the expected timelines – pushing their expected recession start out to the end of 2023 or into 2024. To this effect, the Wall Street Journal’s April survey of economists put the average probability of a recession in the next 12-months at 61%.
Figure 1 – Nearing the next phase of interest rate cycle
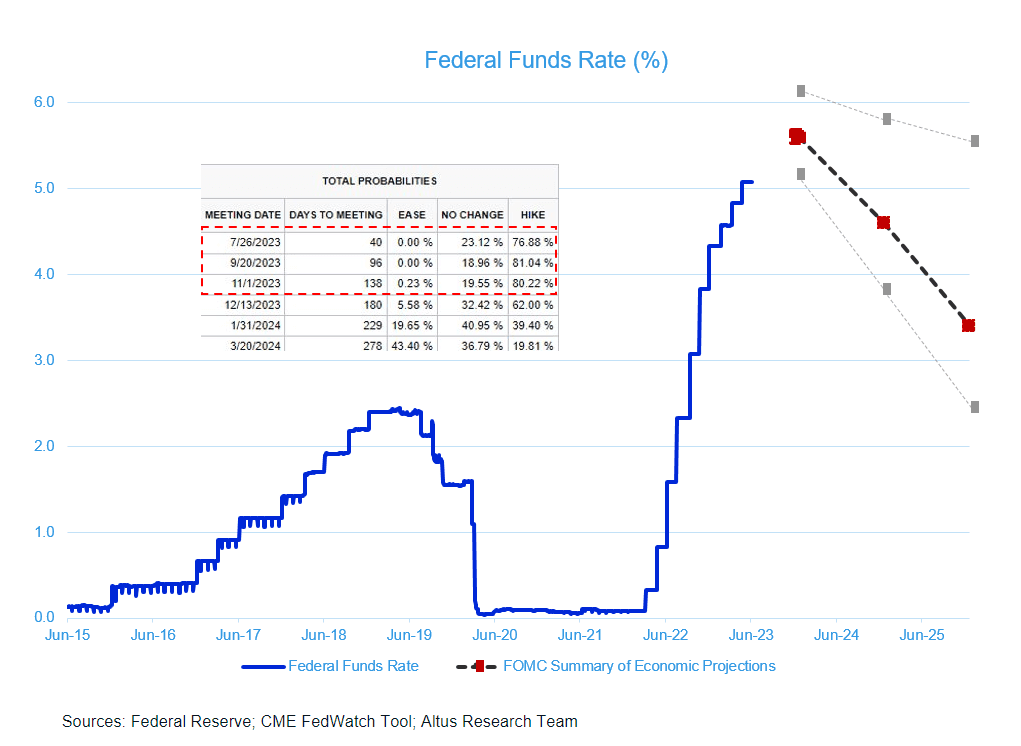
Over the first half of 2023, major central banks continued their monetary tightening, as they battled stubbornly sticky inflation. However, the degree of policy coordination across the different central banks appears to be breaking down as each central bank reacts to differing conditions across their respective economies. The Federal Reserve took its first rate-hike pause during its June meeting, but signaled more hikes were still on the table for 2023. At the time of writing, the markets are anticipating at least one more 25 basis point (bps) increase before the end of the year (according to the CME FedWatch Tool).
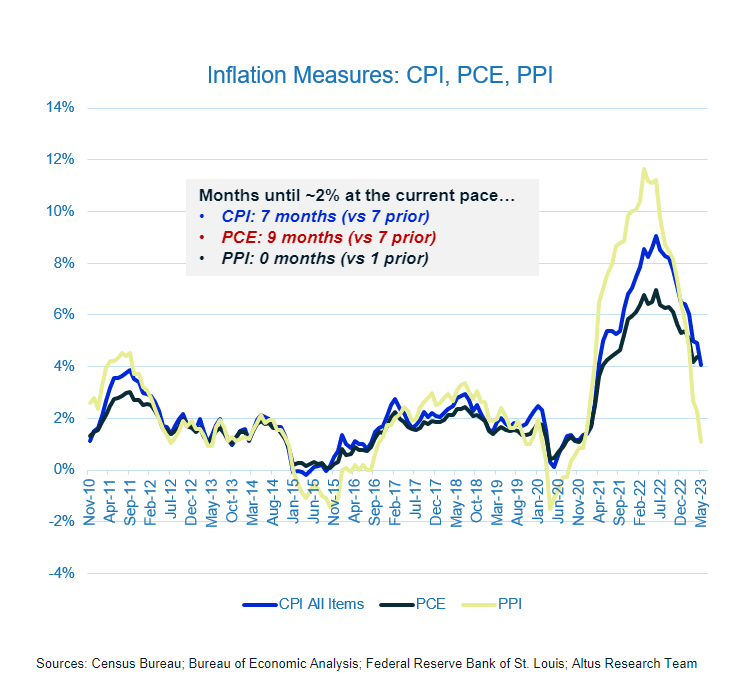
Figure 2 – Inflation cooling – right direction, wrong pace
Missing market activity
Capital market activity has been subdued this year, largely driven by the rapidly rising cost of capital and uncertainty about when and where the cost of capital will land. Despite a seemingly improved macro backdrop from late 2022, the outlook for commercial real estate remains generally pessimistic, weighed down by the realized challenges that lie ahead. In early 2023, rapid rate hikes contributed to a regional banking crisis in the US and the failure of a large international bank in Europe, tightening lending conditions further – including for CRE.
Figure 3 – Limited transactions challenge price discovery
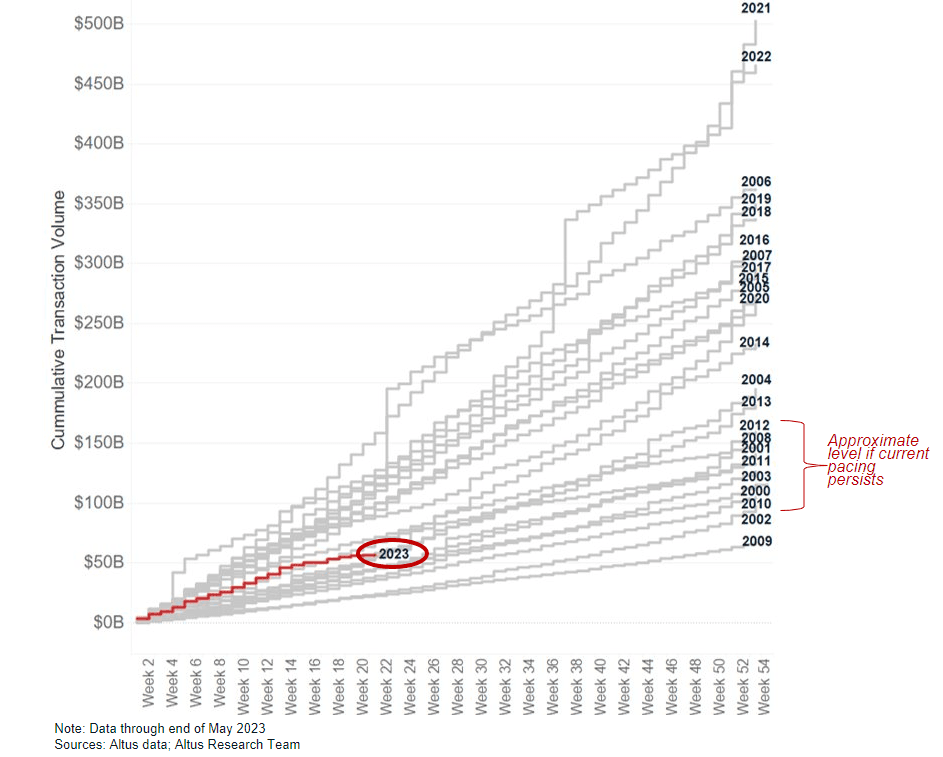
The high-cost and low availability of credit has crippled CRE transaction activity (down by nearly 60% across the US), challenged price discovery, raised concern with regulators and investors, and contributed to a challenged outlook for the asset class. As a result, a primary concern facing the industry right now is recapitalization risk (or more specifically, the inability to refinance maturing debt).
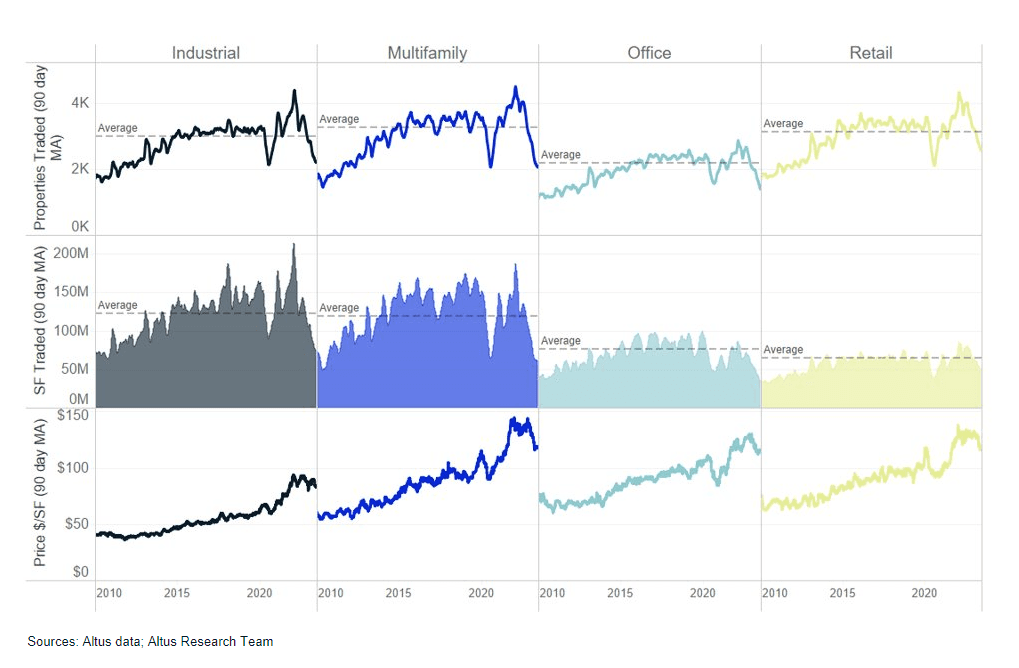
The dearth of current transaction activity combined with the uncertain return of bank capital in the near-term paints a concerning backdrop for the second half of 2023. Property performance metrics across property types (e.g., occupancy, collections, NOI growth) generally remain healthy, but many are beginning to show signs of deterioration.
Figure 4 – Transaction activity is trending the wrong way
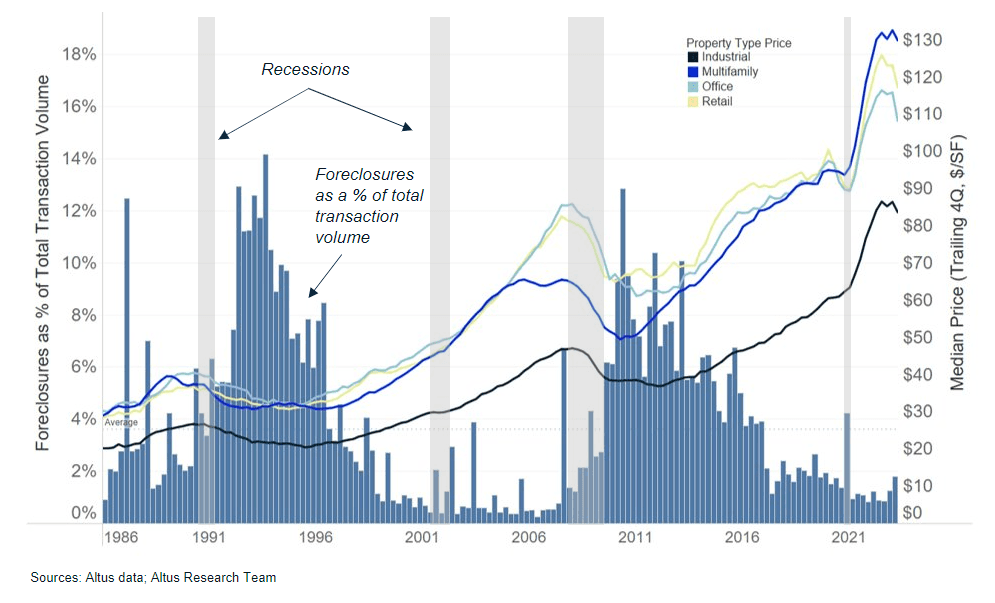
CRE distress signals
While there is little current evidence to suggest that the economy is headed towards a system-shaking experience like the global financial crisis of 2007-09, many across the industry are gearing up for a level of distress not seen since. History suggests that noncurrent rates on loans tend to peak 9-12 quarters after interest rates peak, and CRE distress also tends to have a similar delay in materialization. Commercial real estate seems to be just entering the next phase of its own credit cycle, and if the Fed Funds Rate is expected to peak by the end of the year or early 2024, CRE distress may likely be a key 2024 theme.
Figure 5 – Distress takes time to materialize
Here are some of the key items that caught my eye recently:
Economy
World Bank economists raised 2023 global GDP forecast to 2.1% from 1.7%, while lowering 2024 growth outlook to 2.4% from 2.7%, citing higher interest rates and tighter credit as drivers of slower growth. The 2023 growth forecast is well below the prior year’s pace of 3.1%.
Congress and the President avoided a first-time US sovereign default when they suspended the US debt ceiling through end of 2024, in a last hour deal. The deal pushes out the debt limit beyond the next election cycle and spending caps at $1.65 trillion and $1.67 trillion for fiscal years 2024 and 2025, respectively.
In its June meeting, the Fed refrained from further rate hikes, holding the Fed Funds rate at a range of 5.00-5.25%, as markets expected. However, comments accompanying the release indicated that future rate hikes are still on the table for future meetings. Expectations were set for two more rate hikes, or 50 basis points (bps) increase by year-end.
The US labor market continued to show strength despite initial jobless claims beginning to climb higher. May non-farm payrolls surged by 339,000 and above market expectations. While the official unemployment rate rose to 3.7%, this was due to new entrants into the workforce without employment. Finally, US job openings increased to 10.1 million in May, potentially signaling easing labor conditions.
Inflation is still running well above target and the Consumer Price Index (CPI) rose 4.0% YoY in May while core inflation was 5.3%. Despite a falling trend, the Fed cited the pace of the falling inflation being insufficient. Retail sales through May rose 0.3% month-over-month, indicating continued strength and spending by the US consumer.
Capital markets
The Wall Street Journal reported that US banking regulators may require large banks to raise additional capital buffers by up to 20%, which if true would have major impacts on bank profitability and overall credit conditions across industries.
In the fixed income markets, yields increased over the prior month and credit spreads narrowed slightly. Month over month, the yields on 10 Year US Treasury Securities increased by +37bps, +35bps for AAA paper, and +33bps for BBB. AAA to US Treasury spreads narrowed by -24bps to 85bps, while BBB to AAA yield spread remained flat at 118bps. Term structure across the US Treasury Securities market remains inverted, while the corporate bond market is flat. Mortgage rates increased by about 35bps; 30-year fixed sits near 6.7%.
Stock indices broadly continued their tech-led rally, with many narratives still focused on the potential efficiency and earnings to be delivered by the highly anticipated applications of AI. Broad market indices are up double-digits driven by favored factors: growth and large-cap. Despite much stated concern across markets, overall market volatility (VIX) is low, nearly 0.85 standard deviations from 5-year average.
Commercial real estate
The real estate sector is trailing the broad market. Concerns over leverage across the sector, recapitalization/refinancing needs, and credit issues persist and continue to fuel negative media
CMBS markets remained subdued through May and into June. Year-to-date issuance totaled $31.6 billion, across 53 deals; well below the $156.5 billion in 211 deals from 2022
While REITs have seen some modest recovery from the start of year lows (up approximately 2% YTD), the performance across different REIT sectors varied widely. Single-family rental, industrial, and data centers are all up by double digits on the start of the year, while office and Infrastructure REITs lag and pull down overall indices with negative double-digit YTD performance
Disclaimer: The following commentary is solely the opinion and analysis of the author and does not reflect the views or opinions of Altus Group or any of its related entities or affiliates (collectively “Altus”). The information provided in this article is for informational purposes only. It should not be considered as financial or investment advice. Altus does not endorse or guarantee the accuracy, completeness, or reliability of any information mentioned in this commentary. The author and Altus shall not be held responsible for any decisions made based on the information provided in this blog.
Author

Omar Eltorai
Senior Director of Research, Altus Group
Author

Omar Eltorai
Senior Director of Research, Altus Group
Resources
Latest insights


