US commercial real estate market update - May 2023
The pretty good, the not-so-bad, and the potentially ugly factors impacting the US market.

Key highlights
Conflicting signals from the economy continue to muddle the development of a ‘new normal’ narrative
The interpretation of the current market is largely subjective, with signals ranging from ‘pretty good’ to ‘not-so-bad’ and ‘potentially ugly’
If the current pace of transaction activity continues through the rest of the year, the annual investment volume will be in line with 2010-2012 levels
An uptick in CRE asset class distress (notably across the office sector) is expected, but the severity of the distress is still unknown
Current market conditions (cooling inflation, loosening labor conditions, and ongoing banking crisis) may give the Fed reason to begin cutting rates as early as September
We are nearly halfway through 2023 and the mood still seems mixed. With conflicting signals from the economy and markets to contend with, narratives continue to shift and it seems as though for every sign of strength, there is at least one negative.
One interpretation of this is that capital markets are still in a period of transition, where market expectations are shifting quicker than the data. Without a broad-base consensus view, public markets remain volatile and private markets largely muted. While many new narratives are being thrown around, it will take time before they are thoroughly vetted, and one can be crowned the “new normal”.
Conflicting data and clashing expectations have meant that there is no definitive signal of economic strength or stress, which has exacerbated the showdown of potential narratives.
Showdown: (pretty) good, (not-so) bad, and (potentially) ugly
So much of the interpretation of the current market is subjective. Heading into the summer months, one way of summarizing the situation is to characterize the signals into the following categories:
(pretty) good,
(not-so) bad, and
(potentially) ugly.
First, let’s consider the ‘pretty good’. These are indicators or signals that the economy and capital markets are healthy or resilient. For example, the economy is not in a recession; however, in April 2023, 61% of economists surveyed by the Wall Street Journal were anticipating a recession within the next 12 months, up from 28% a year earlier. Other indicators in the category include:
Cooling inflation, which is still higher than the Federal Reserve’s target range but continues to fall to healthier levels. Despite the encouraging trajectory, some of the Fed official’s commentary suggest that inflation is not cooling quick enough.
US consumer spending has remained resilient, with retail sales climbing moderately in April by 40 basis points (0.4%) from March. However, this is increasingly being financed by consumer credit cards which have seen a dramatic rise in cost and are beginning to show signs of higher delinquency rates.
While the Fed has not committed to a pivot, it has raised the possibility of a pause in additional rate hikes. Currently, the markets are expecting the Fed to hike once more (25 bps) in June, before pausing, and then cutting in November.
Figure 1 – Inflation Measures: CPI, PCE, PPI
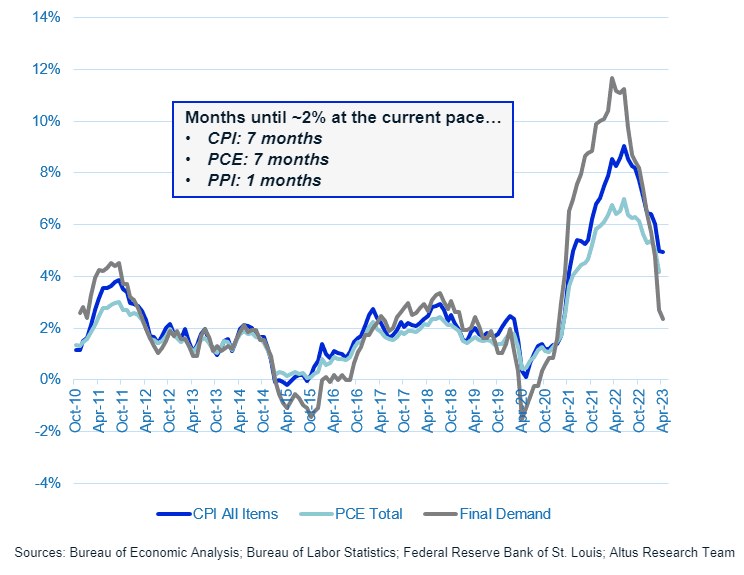
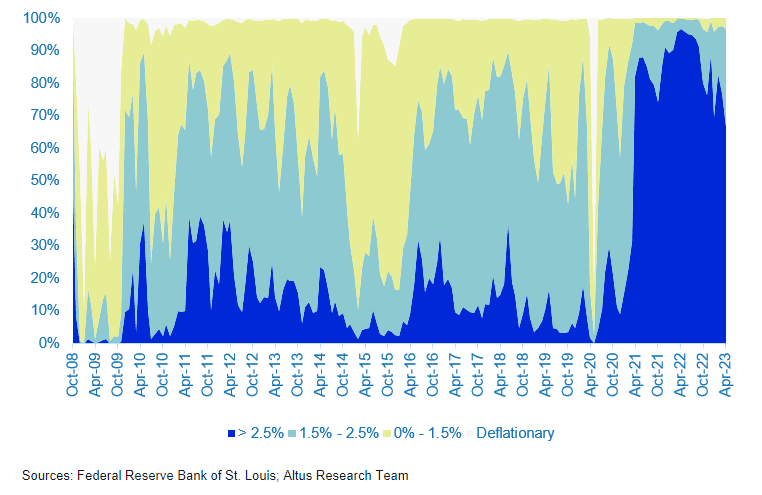
Figure 2 - Inflation probabilities (12-month outlook)
Second, we have the ‘not-so bad’. While these aren’t signals of imminent doom, these indicators are not positive, either. For example:
First quarter corporate earnings beat expectations, but are the second consecutive quarter of decline. Beat was driven predominantly by higher-than-expected revenues. Overall, stock market valuations remain relatively rich compared to long-term market valuations.
The failure and resolution of First Republic Bank, signaled that there continues to be stress in the banking system, but also that the regulators are quick and ready to intervene to stabilize. While this quick response is somewhat comforting, more bank failures would certainly be disruptive.
Consumer confidence waning, as consumers are more concerned about the future than they are about the current situation.
Third, let’s look at the ‘potentially ugly’. These are factors that have the potential to dramatically change the situation and market at large. For example:
Heightened domestic political risk in the US, as we approach an election year. While a debt ceiling crisis seems to have been averted by a last-minute deal in Washington, political risk remains high and will likely continue to be exacerbated by the clear lack of bipartisanship.
As the Ukraine-Russia conflict in Europe continues to escalate, global geopolitical tensions increase with potential economic implications.
While many public markets are already pricing in the central bank pauses or pivots, the extent of credit deterioration has yet to be seen. Many vulnerabilities remain, making the overall financing situation fragile.
What does this mean for CRE?
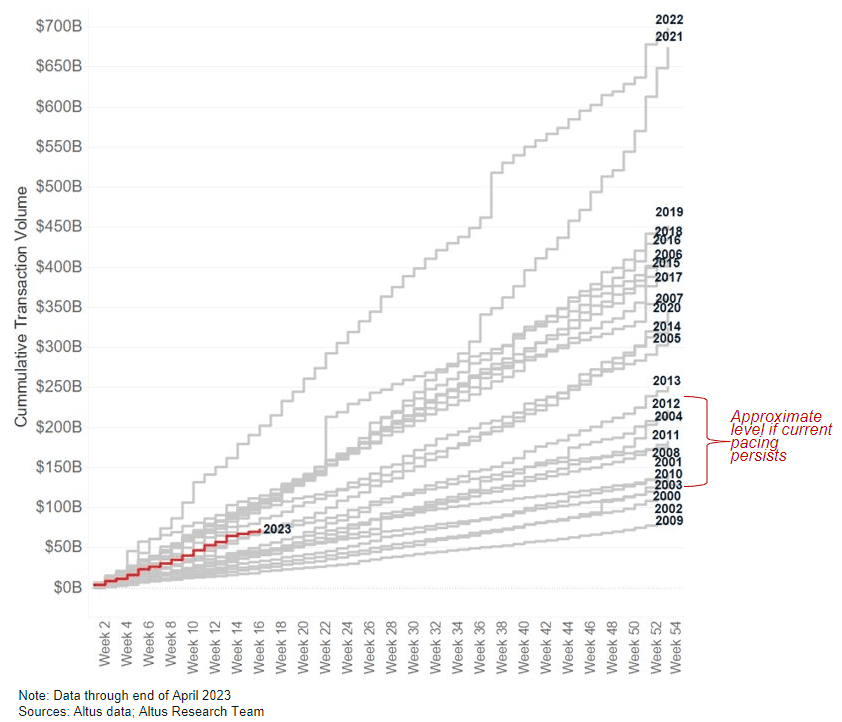
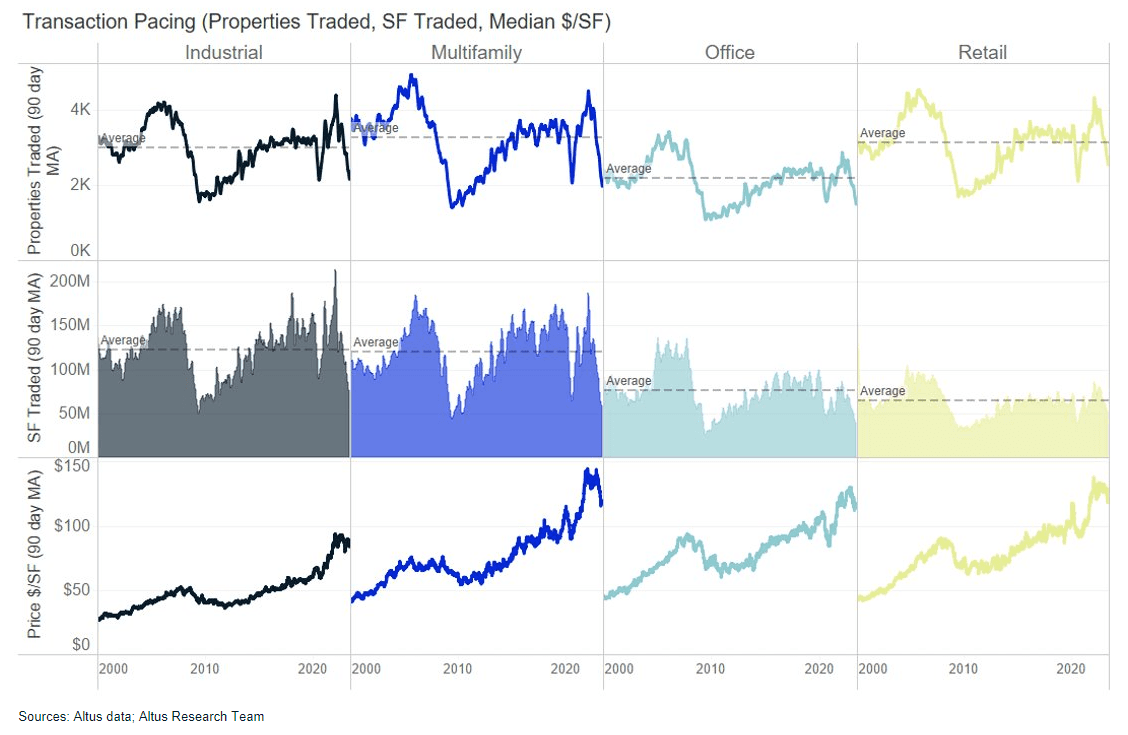
There is no denying it – CRE has struggled significantly in 2023. While the high cost of financing all but killed transaction activity while the banking crisis raised concerns about CRE asset prices, the cooling economic growth is dampening CRE cash flow growth expectations. If the current pace of transaction activity continues through the rest of the year, the annual investment volume will be in line with 2010-2012 levels.
Figure 3 – Cumulative transaction volume
At the same time, more distress and heavily discounted transactions are taking place – most notably across office sector, but also across non-office sectors. While distress has not materialized widely across the asset class, it is expected to increase materially. Even though delinquency rates remain below historical averages, increased watchlist and special servicing rates suggest that an uptick in distress may be sooner than later.
Figure 4 - Bank CRE delinquency and charge-off rates
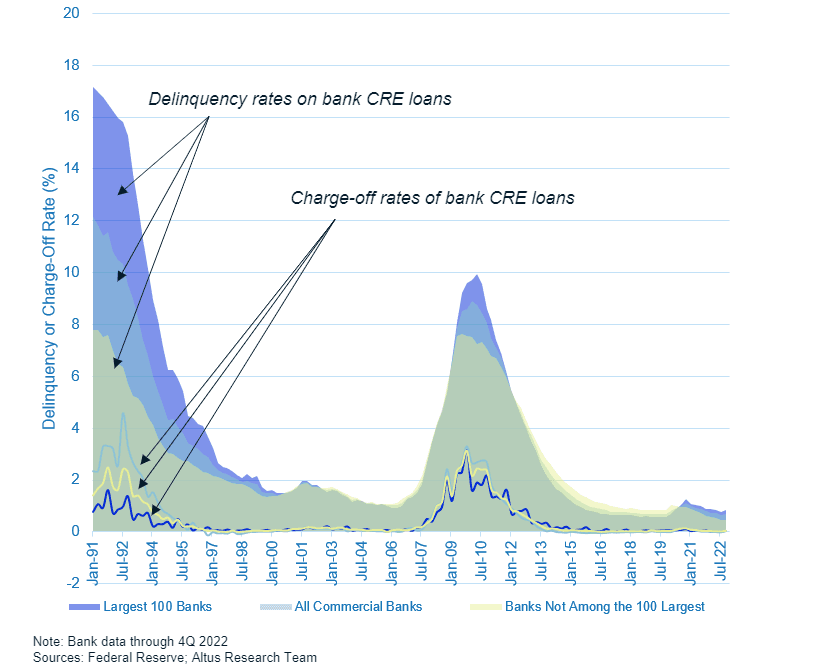
Figure 5 - Transaction activity falls sharply
Economy
After raising rates by another 25bps, the Fed indicated that further rate decisions will be on a meeting-by-meeting basis, giving hope to the market that a pause or pivot is on the table. Current market conditions (cooling inflation, labor force softening, and ongoing banking crisis) may give the Fed reason to begin cutting rates as early as September.
The revised GDP figures released show that the US economy grew more slowly than initially projected. US GDP expanded by 1.1% in Q1, down from an initial reading of 2.6%. Business investment and falling inventories were the main drivers of the revision, while consumer spending was revised down moderately. The US labor market added 253,000 jobs in April, well-above market expectations (185,000) and unemployment fell to the lowest level in over five decades (3.4%). Productivity remains a problem in the US, as unit labor costs rose at an annualized rate of 6.3% quarter over quarter, up from 3.2% in fourth quarter of 2022.
The Conference Board’s US Leading Economic Index declined 1.2% in March – marking the 12th consecutive monthly decline. The index currently sits at its lowest level since November 2020. Also reflecting concern, the Federal Reserve’s Senior Loan Officer Opinion Survey revealed that credit conditions remained extremely tight through the first quarter with bankers reporting tightening standards and the weakest demand for loans since 2009.
Higher mortgage rates contributed to US existing home sales declining 2.4% month-on-month in March and 22% year-over-year. The National Association of Realtors announced that home prices declined in more parts of the US than they have in over a decade during the first quarter. Nearly one in three metro areas saw price declines from a year ago, the highest percentage of markets in the red since 2011.
Capital markets
Market trading and volatility was intensified by concerns that the US Department of the Treasury will default if the nation’s debt limit is not raised before it exhausts its cash on hand. While negotiations are on-going (or at least not stalled), the political risk and uncertainty may increasingly take center stage as the “X date” approaches.
Banking woes persisted in the US, as another lender (First Republic) failed. Despite the swift seizure and resolution via sale to JPMorgan Chase, the markets continued to scrutinize and add pressure to other bank stocks. While some of this pressure abated as banks reported 1Q earnings and shared positive liquidity/funding positions, the market pressure combined with the expected regulatory scrutiny continues to weigh heavily on the sector. During first quarter earnings calls, banks noted increased loan loss reserves, particularly for anticipated commercial real estate write-downs.
Commercial real estate
Market concern over CRE valuation and potential performance did not materialize in the first quarter. Despite the continued under-performance of many publicly traded REITs, in aggregate REITs reported NOI growth of 2.16% YOY and same store NOI growth of 7.17%, reported by NAREIT. Occupancy rates remained supportive, slipping 47bps to 93.13% for all equity REITs. The sector of most concern is office, which saw occupancy slip by 70bps QOQ to land at 88.74%.
Private real estate reflected similar trends, as higher cost of capital continued to stall out the market investment activity and push cap rates higher. While most sectors posted negative returns to investors, retail was a stand-out sector, posting the best sector-level returns for the second consecutive quarter, per NCREIF data.
Disclaimer: The following commentary is solely the opinion and analysis of the author and does not reflect the views or opinions of Altus Group or any of its related entities or affiliates (collectively “Altus”). The information provided in this article is for informational purposes only. It should not be considered as financial or investment advice. Altus does not endorse or guarantee the accuracy, completeness, or reliability of any information mentioned in this commentary. The author and Altus shall not be held responsible for any decisions made based on the information provided in this blog.
Author

Omar Eltorai
Senior Director of Research, Altus Group
Author
Omar Eltorai
Senior Director of Research, Altus Group
Resources
Latest insights