Key highlights
Remote and hybrid work are shifting supply-demand dynamics across all office markets, resetting equilibriums – NYC is no exception
Declining demand is weighing down on occupancy, rents, and renewal probabilities
Rising expenses, once offset by reliable strong demand, are now making owning office a more capital-intensive endeavor and putting realizable returns at risk
A chasm is forming across many of these aggregate market performance health metrics, separating the best from the rest
The economic difference (NOI) between newer buildings and older buildings is 2.5x
While the return-on-investment calculation of potential capital improvements is never straightforward, for many NYC office owners, capital investment decisions must be explored soon, because inaction may not be a viable strategy
What is happening to NYC’s office sector?
Investing in New York City office properties has always presented challenges. For many NYC office owners, however, these investment decisions may become even more difficult over the coming years.
While the wide adoption of hybrid and remote work has placed the office sector under the unforgiving spotlight of mainstream media headlines and softened many market fundamentals, commentators’ calls for an apocalyptic demise of office space seem hyperbolic. That said, data is beginning to show signs of the shifting supply-demand dynamics across markets, as new equilibriums are found. This re-setting is affecting markets big and small – and NYC is no exception.
The net decrease in demand for office space has left many markets, including NYC, oversupplied. Aggregate market data show weakening fundamentals; declining demand is weighing down on occupancy, rents, and renewal probabilities. Rising expenses, once offset by strong demand, now make owning a more capital-intensive endeavor and put realizable returns at risk.
In aggregate, the picture looks severe; however, looking a little deeper, we observe a silver-lining: newer, high-quality office buildings are increasingly outperforming their local market benchmark. A chasm is forming across many of these aggregate market performance health metrics, separating the best from the rest. While this chasm is widening, it is a sign that there is still demand.
Using Altus Valuation data covering more than 80 million square feet of Manhattan office space from the past decade, we will show how the NYC office market is evolving.
A chasm is forming: The best vs the rest
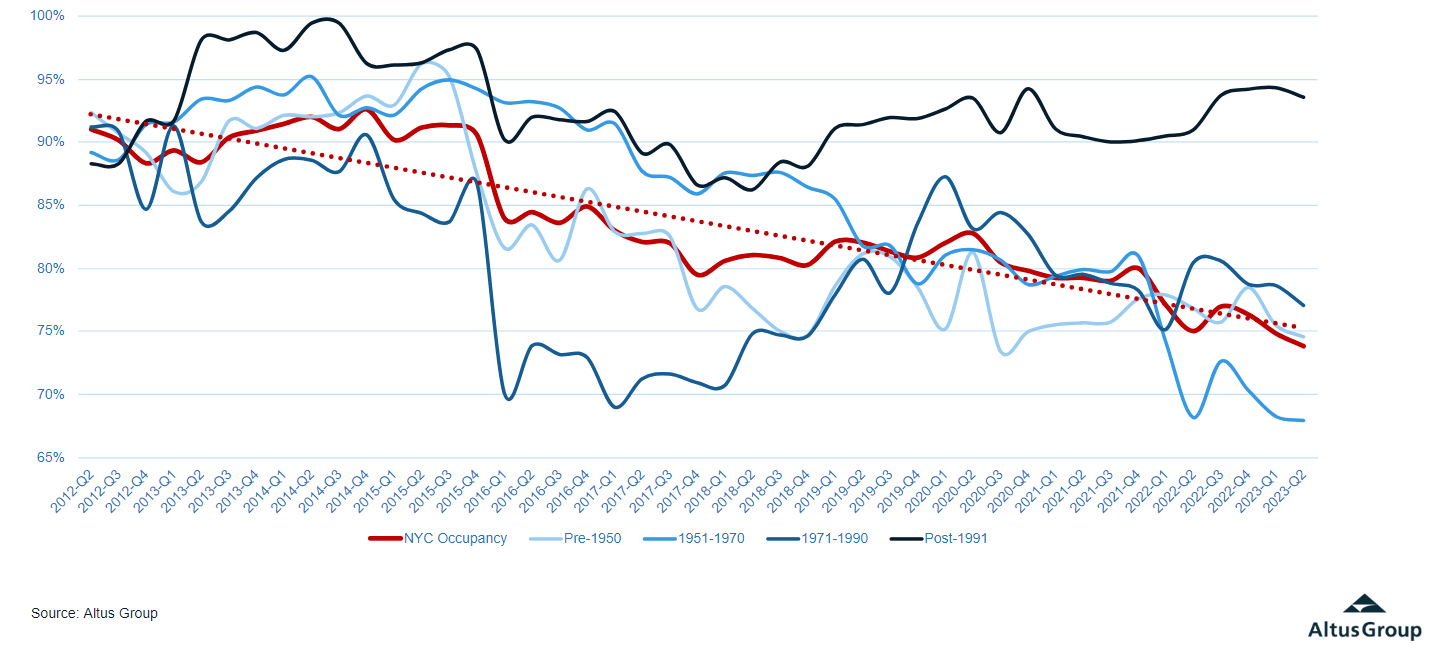
Declining occupancy: NYC office occupancy has been in decline over the last decade, falling from around 90% in late 2015 to mid-70% recently. The declining occupancy rate has been most pronounced across older buildings built before 1991. The newer buildings, built in 1991 or later, have largely bucked the decline, and maintained occupancy above 90%.
Figure 1 - NYC office occupancy by building age
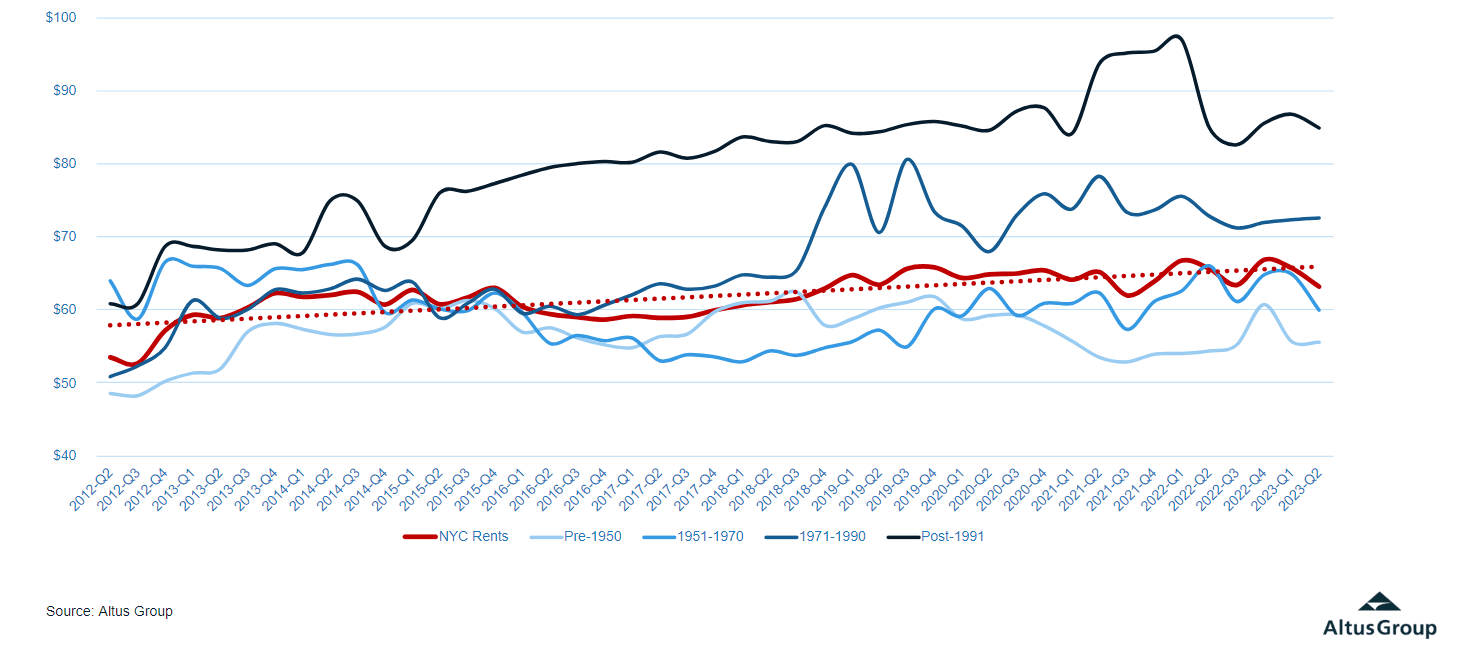
Flat rent growth: In-place rents have grown by approximately 1% per year over the last decade for NYC office, well below inflation during the same period. However, rent growth for newer buildings has outpaced that of older buildings. Over the last decade, newer office buildings in NYC saw rents grow approximately 30% to $85/SF, while rents for older buildings grew closer to 15%.
Figure 2 - In-place office rents by building age
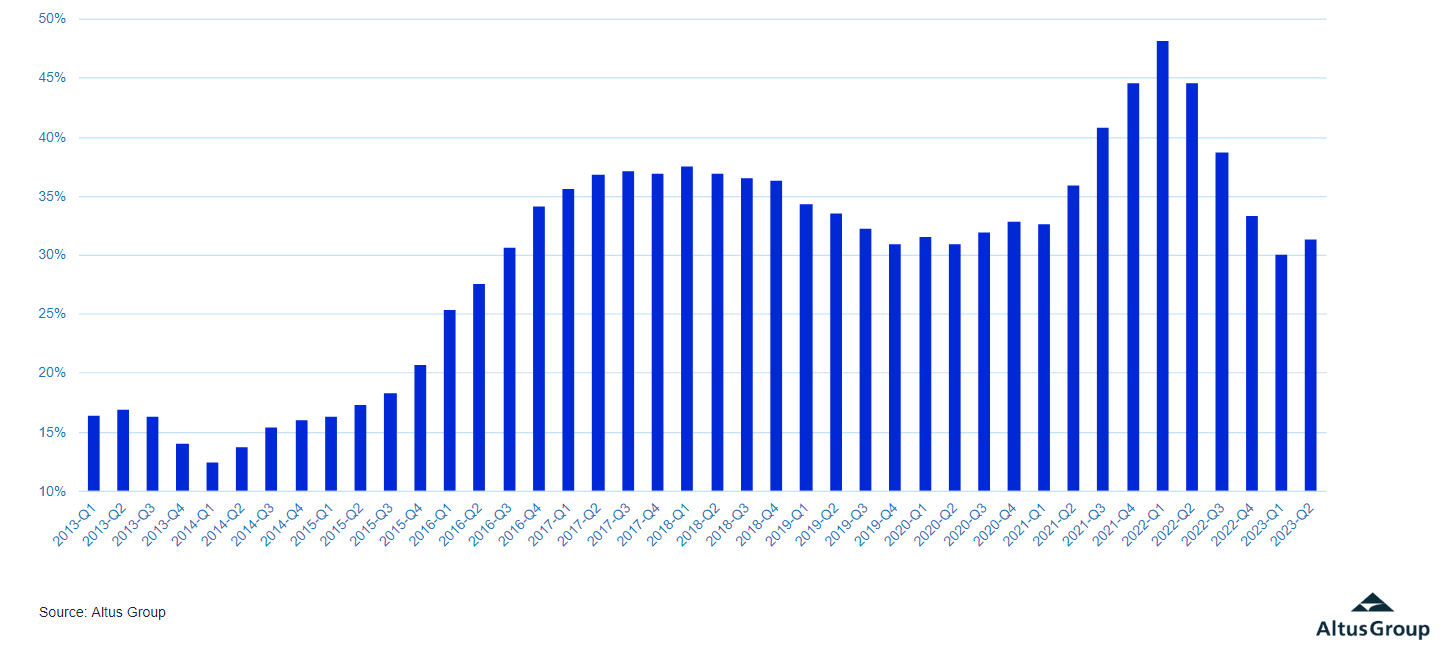
Elevated rent premiums: The rent premium that newer buildings command compared to older building nearly doubled over the decade, to nearly 30%. This premium peaked at 48% in early 2022, before falling back to the recent range of 30-35%.
Figure 3 - Elevated rent premiums: Newest vs. market, 4Q average
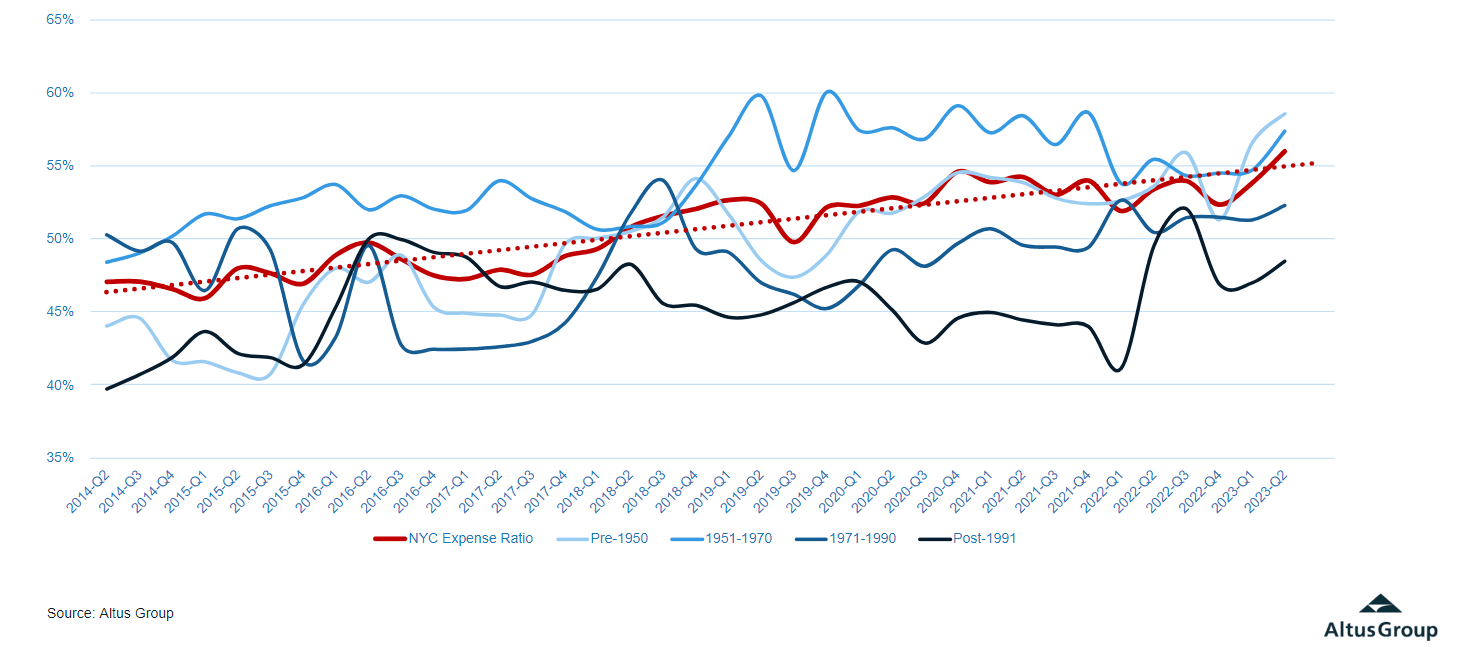
Expense ratios increase: Operating expenses as a percentage of effective gross income have increased nearly 10% over the last decade, from 47% to 56%. While all property vintages have seen expenses increase, the older buildings have seen more substantial increases – closer to 15% over the past decade.
Figure 4 - Expense ratios have increased
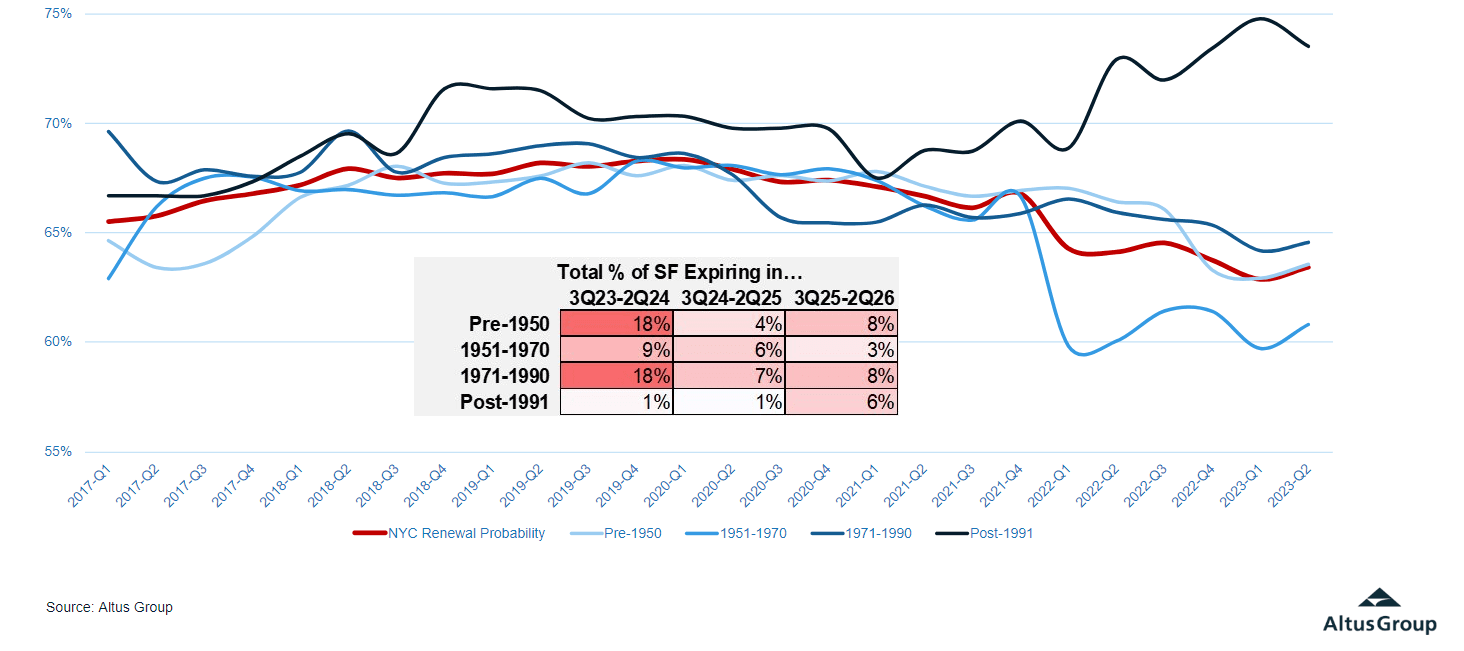
Renewal probabilities diverge: Lease renewal probabilities were largely stable and remained above 65% until 2021. However, over the last two years, renewal probabilities for NYC office have declined, reflecting increased uncertainty with leasing activity. While the overall renewal probability has recently slipped below 65%, this decline has been driven entirely by older office stock. Meanwhile, renewal probabilities for newer buildings have reached new highs recently, around 75%.
Figure 5 - Lease renewal probabilities have diverged

Predictive analytics and market insights
Altus Market Insights incorporates market intelligence and predictive analytics into your daily workflows and key decision-making.
Decision time is approaching
With nearly 4 million square feet of currently leased office space expected to mature over the next four quarters (the majority of which is in pre-1990 constructed buildings), the chasm between the best and the rest is likely to continue to widen.
Current owners with older buildings and rolling tenants may be faced with the difficult decision of investing in their properties enough to jump the chasm and command higher rents and occupancy, or adjust to the new market equilibrium.
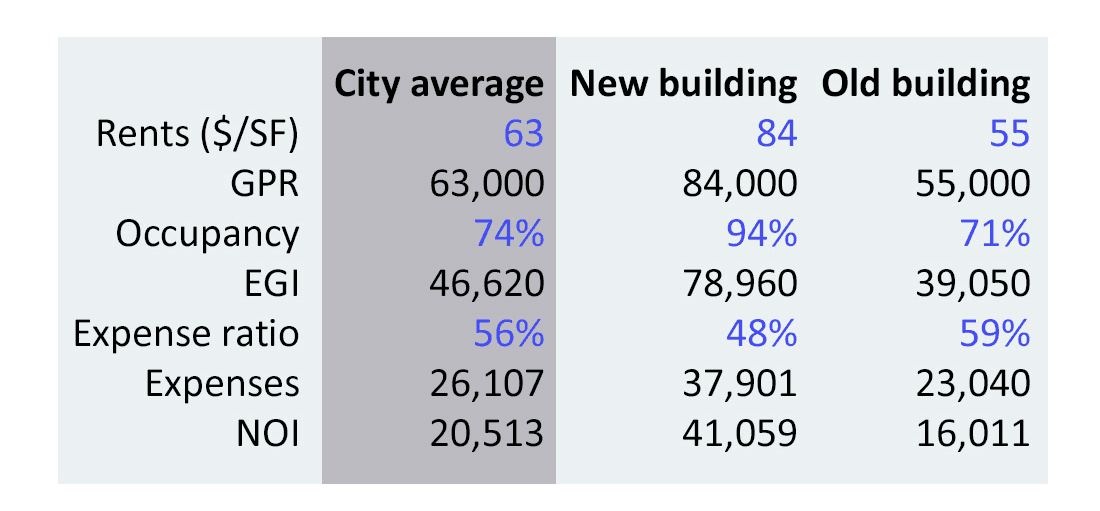
Using recent Altus Valuation, one can see that the economic difference, as measured by NOI, between newer (higher-quality) buildings and older (lower-quality) buildings is 2.5x. So, while the return-on-investment calculation of potential capital improvements is never straightforward, for many NYC office owners, the capital investment decision must be explored, because inaction may not be a viable strategy.
Author

Omar Eltorai
Senior Director of Research, Altus Group
Author
Omar Eltorai
Senior Director of Research, Altus Group
Resources
Latest insights

May 19, 2026
Solving operational challenges and accelerating insights through data integration