The 5 US cities for multifamily investments that are most likely to outperform benchmarks
Using the Capital Asset Pricing Model, we’ve identified the top 5 US cities for multifamily investments that are most likely to outperform benchmark returns.

Key highlights
Using the alpha and beta scores derived from Altus Market Insights, Altus Group’s Sally Johnstone identified the top 5 US cities for multifamily investments that are most likely to outperform benchmark returns
Johnstone’s analysis revealed something interesting – almost all the top-performing cities for multifamily returns were located in the Sunbelt, including Florida and Texas
Perhaps unsurprisingly, the worst-performing cities were “gateway cities” where the multifamily sector is still struggling to find its footing in the post-pandemic landscape, such as San Francisco, Seattle, LA, and NYC
Data provides a uniquely objective view of what’s happening in the market, so CRE investors can make realistic and accurate predictions to support their investment decisions
What cities are most likely to beat the benchmark for multifamily returns?
In his best-selling novel, The Intelligent Investor, Benjamin Graham wrote, “Successful investing is about managing risk, not avoiding it.” This is a core, guiding principle for any investor. It’s not a matter of picking the path without risk – because no such path exists – rather, it’s about minimizing risk to increase the chances of the chosen path taking you where you want to go. Or, at the very least, it’s the skill of choosing a level of risk that is worth the associated reward.
In the world of commercial real estate (CRE), striking the balance between risk and reward is often the key to a successful, diverse portfolio of properties.
There are, of course, a variety of factors to consider when deciding which sectors and which areas to invest in. What is the state of the market? What is driving returns? What sectors are more vulnerable to volatility in the market? How can you react to changes in the market? What is your degree of risk? How do you balance your allocation? Perhaps more importantly – what is the benchmark rate of returns, and what is your potential for beating it?
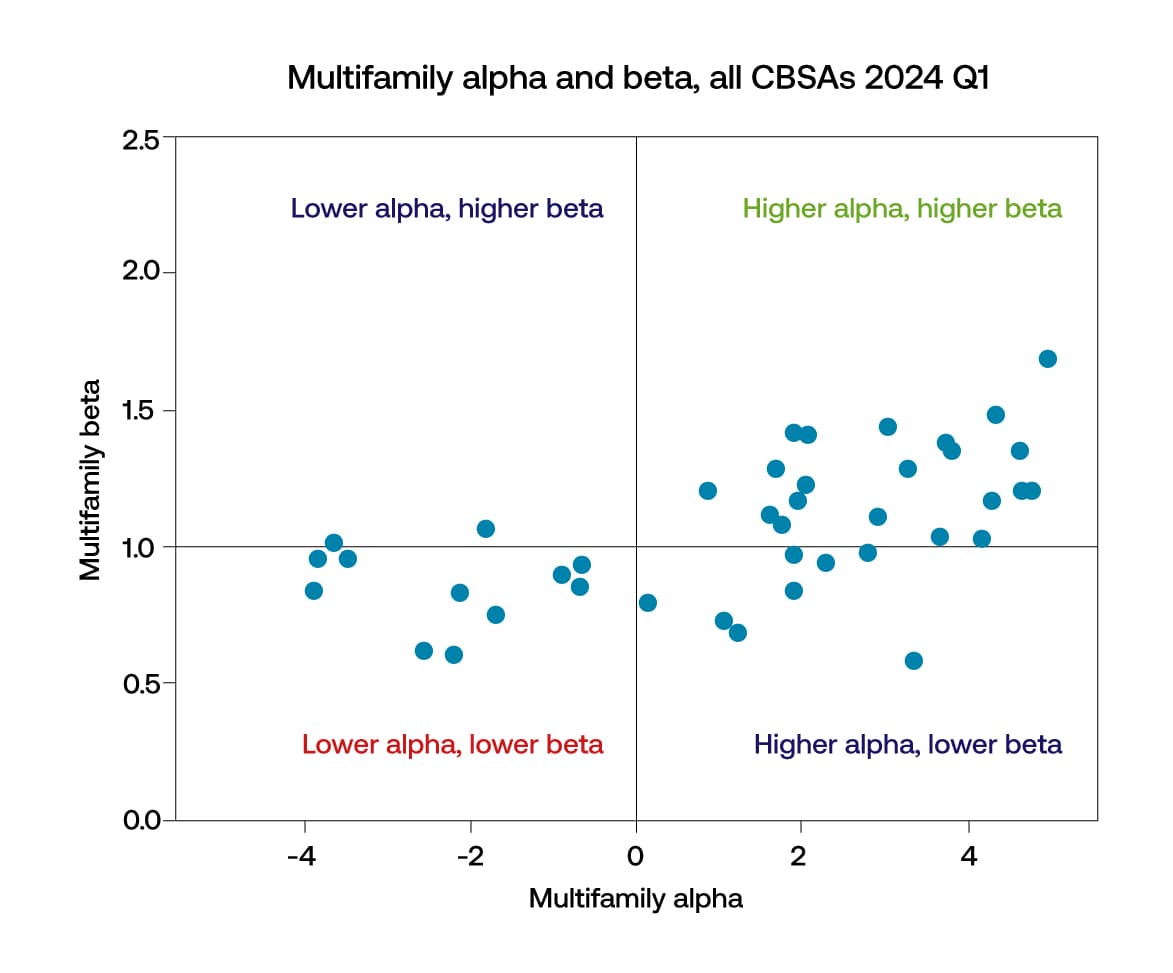
To identify the top 5 US cities for multifamily that are more likely to outperform the benchmark than other cities, Sally Johnstone, Sr. Manager, Market Insights Delivery at Altus Group, leveraged the Capital Asset Pricing Model (CAPM) via the Altus Market Insights offer. This model provides an alpha and beta score that predicts the future performance of CRE sectors in different markets compared to benchmark returns. To understand the scores provided in Johnstone’s analysis, which was completed in Q1 2024, it’s important to know the following:
The alpha score measures how well an investment performs compared to the benchmark, based on its risk
A city/sector combination with an alpha score of zero and a beta score of 1 is expected to perform in tandem with benchmark returns
A positive alpha score indicates a city/sector combination that is expected to outperform benchmark returns
A beta score greater than 1 carries greater risk, but also a greater potential reward
Higher betas outpace the benchmark when the benchmark is increasing (but also bring more downside risk, as they decline faster than the benchmark)
In simple terms, CAPM helps an investor understand the relationship between the expected return on an investment (the reward) and the risk associated with it.
Figure 1 - The top 5 US cities for multifamily investments expected to outperform the benchmark, using the Capital Asset Pricing Model (CAPM)
A more detailed breakdown of the CAPM approach is provided at the bottom of this article.
What is so special about the Sunbelt?
Johnstone’s analysis revealed something interesting – almost all of the cities expected to generate above-benchmark returns for multifamily returns were located in the Sunbelt, including Florida and Texas. Moreover, four of the top five cities have been in the top five as long as we’ve been tracking the metric.
Perhaps unsurprisingly, the worst-performing cities were “gateway cities” where the multifamily sector is still struggling to find its footing in the post-pandemic landscape, such as San Francisco, Seattle, LA, and NYC. On the other hand, Boston, San Diego, and Washington DC emerged as some of the only large, coastal cities to have maintained a consistent, positive alpha score over the past year. This trend can likely be attributed to economic growth in those regions, driven in part by life science and government spending.
Top 5 multifamily sector alpha cities: | Alpha | Beta |
|---|---|---|
Phoenix-Mesa-Scottsdale, AZ | 4.9% | 1.68 |
Durham-Chapel Hill, NC | 4.7% | 1.2 |
Fort Lauderdale-Pompano Beach-Deerfield Beach, FL | 4.6% | 1.2 |
Tampa-St. Petersburg-Clearwater, FL | 4.6% | 1.35 |
West Palm Beach-Boca Raton-Delray Beach, FL | 4.3% | 1.48 |
Phoenix-Mesa-Scottsdale, AZ
Notably, Phoenix has landed in the top 5 alpha scoring cities since we began tracking this metric.
We can presume that the performance of Phoenix’s multifamily sector is influenced by population and household income (HHI) growth. Over the last three years, Phoenix’s population and HHI growth rate exceeded 5%, while the average city was closer to 3% for both metrics. To this effect, cell phone movement data indicates that Phoenix-Mesa-Scottsdale, AZ has welcomed more new residents over the past two years than other cities. In fact, 2020 census data revealed that Phoenix grew at a faster rate than any other major city in the last decade.
While the median HHI and growth in HHI in Phoenix are on par with other cities, home values have increased at a slightly higher rate. Moreover, the percentage of households that are rented, rather than owned, is slightly higher than average. Phoenix’s gross area product (GAP) also grew at a faster rate than other cities over the past 3 years, as did labor force growth, while the unemployment rate remained near average.
“Taking a closer look at the rental market in Phoenix, we see that renter costs are about 40% higher than average, and over the past three years renter costs in Phoenix have grown at about twice the pace of the average city,” notes Johnstone. “While high renter costs drive higher revenues, it’s important to note that increased demand is not without its challenges. Eviction filings in Phoenix have surpassed pre-pandemic levels, which may lead to a slight increase in the associated credit/loss number in the near term.”
Recently, the supply of new multifamily units in the Phoenix area has outpaced the growth in renter households, which constrained some rent growth. However, that imbalance appears to moderate in the near future, with fewer new units coming on the market in 2024 and 2025 than the average over the past three years. In short, we expect Phoenix to remain within the top 5 alpha cities for the near future.
“When looking at a region that seems primed for returns based on an influx of migration and demand, it’s a good practice to look at development permits issued and compile the number issued for a two or three-year period,” Johnstone adds. “You can then compare that to projected household growth in the following two or three-year period. Supply tends to follow demand in real estate; in other words, when developers see demand, they start building to capitalize on the lack of supply. If you notice a ratio of permitted units that exceeds 1.5 for every anticipated new household over the next few years, you can anticipate that a period of over-supply may be on the horizon. We predicted the softening of rent growth in Austin, TX, for example, when we noticed in late 2022 that the ratio of permitted units to new households was 2.4." The caveat, in the current market, is that with a high cost of capital and materials, some of the projects that have been permitted may no longer pencil out.

Predictive analytics and market insights
Altus Market Insights incorporates market intelligence and predictive analytics into your daily workflows and key decision-making.
Durham-Chapel Hill, NC
Durham-Chapel Hill, NC has also been in the top 5 alpha cities since we started tracking this metric. Raleigh, NC, which we calculated separately from Durham-Chapel Hill, has a respectable 3.3% alpha. This indicates that there is geographic consistency in anticipated risk-adjusted returns beating the benchmark in the future.
“Durham-Chapel Hill has one of the highest productivity rates of any city; the Gross Regional Product (GRP) per capita is 1.5x the US average, and its GRP grew at twice the rate of the average US city from 2021 to 2024,” explains Johnstone. “This region’s rate of educational attainment – the percentage of adults with at least a bachelor’s degree – is one of the highest in the country, while its labor force growth remains slightly greater than the US average, and its unemployment rate trends lower.”
Renter costs in Durham-Chapel Hill are close to average for cities; however, both its median household income and median household income growth are higher than the average city. Population growth and household growth in Durham-Chapel Hill have also slightly outpaced surrounding US cities.
Fort Lauderdale-Pompano Beach-Deerfield Beach, FL
Fort Lauderdale-Pompano Beach-Deerfield Beach, FL has also found itself in the top 5 alpha cities since we started tracking this metric.
Much like Phoenix, renter costs are higher in this region than average and have increased at double the pace of other cities. Moreover, Fort Lauderdale has a slightly higher percentage of renter households than other cities. Fort Lauderdale’s population and labor force growth over the past three years has been slightly higher than other cities, while its unemployment rate remains slightly less than the metropolitan average. The region has also seen a continued influx of new residents, as the number of people moving into the Fort Lauderdale area over the past two years is within the top 10 for cities in the US, based on mobile phone data.
“Notably, Fort Lauderdale’s supply of new multifamily units has not significantly outpaced growth in renter households over the past few years,” notes Johnstone. “As a result, we have not observed the materialization of a supply-demand imbalance, which would constrain rent growth.”
Tampa-St. Petersburg-Clearwater, FL
Tampa-St. Petersburg-Clearwater, FL is the fourth region that has made it into our top 5 alpha cities since we started tracking this metric last year.
Population and household growth in Tampa are slightly greater than the average city; median household income and median household income growth are slightly lower than the average city.
“The growth of the labor force in Tampa from 2021 to 2024 was significant – in fact, it was about double the average city’s labor force growth, and its unemployment rate has consistently trended lower than average,” adds Johnstone. “Renter costs and renter cost growth are slightly higher than average, as is Tampa’s per capita GAP.”
Tampa has also seen the third greatest number of people moving into a US city over the past two years, based on cell phone movement data.
West Palm Beach-Boca Raton-Delray Beach, FL
West Palm Beach-Boca Raton-Delray Beach, FL is a new entry to our top five, though it has been in the top 10 as long as we’ve been tracking this metric. Much like the other cities in our list, it’s seen greater labor force and population growth than the average US city. Median renter household income and household income growth over the past three years is greater than the US average. At the same time, median renter costs in West Palm Beach are higher than across the US, and those costs grew at 2x the rate of renter cost growth in the average city. Once again, West Palm Beach is also one of the top 5 cities for number of new residents, according to cell phone data.
“While its per capita GAP is not as high as Durham-Chapel Hill’s, it is higher than others in the top 5 and certainly higher than the US average,” explains Johnstone. “This is likely due to its higher percentage of population with a bachelor’s or higher degree. Education attainment is an important metric to keep an eye on.”
Conclusion
“Ultimately – we all have our theories about what’s going on in the market, where the opportunities are, and where the high-risk regions are – but if you’re not looking at the data, you don’t really know,” explains Johnstone. “Data provides a uniquely objective view, so you can make realistic and accurate predictions with your investment decisions. At any given time, there are countless interpretations of trends happening in the market, and there is always a risk of exogenous shocks to the system that are impossible to predict, like the pandemic – but data helps cut through the noise to tell a more objective story.”
This is where alpha and beta scores can help to inform allocation decisions – you can examine how your portfolio is laid out for alpha and beta, and then evaluate your potential for beating the benchmark rate of return. “You can have high alpha, high beta, and in a growing market your investment will grow more than others,” adds Johnstone. “But in a declining market, that investment will be more volatile. So, considering both alpha and beta allows you to thoughtfully balance your allocation when deciding on city and sector combinations.”
Understanding CAPM
Capital Asset Pricing Model (CAPM) is a financial model that calculates the expected rate of return for an asset or investment by using the expected return on both the market and a risk-free asset, and the asset’s correlation or sensitivity to the market (beta). In simple terms, CAPM helps you choose the best city and sector by balancing expected returns with the level of risk, guiding you toward investments that align with your risk tolerance and return goals.
Alpha and beta scores are based on the past 20 quarters of city/sector data for a given region. A positive alpha indicates returns that outperformed the benchmark, while a negative alpha indicates constrained returns compared to the benchmark. The beta score, on the other hand, reflects a city/sector combination’s relative sensitivity to the changes in benchmark returns. Please note that for our analysis, we use the NCREIF NPI as our benchmark.
For a deeper dive into this model and the validity of alpha as a predictor of future risk-adjusted returns, skip to minute 4:00 of our webinar: Using Data Science to Improve Your CRE Portfolio
Want to be notified of our new and relevant CRE content, articles and events?
Author

Lauren Ramesbottom
Senior Copywriter
Author
Lauren Ramesbottom
Senior Copywriter
Resources
Latest insights