US commercial real estate transaction analysis – Q1 2024

Key highlights
Hopes for a rapid return to higher levels of commercial real estate (CRE) transaction activity did not come to fruition in the first quarter of 2024, likely due to the still challenging market conditions
Overall CRE transaction activity through Q1 2024 continued to be subdued, down by more than 20% compared to 2023 levels
Despite this, appetite for CRE remains high, suggesting that a late-2024 rebound in transaction activity may be more probable
Early rate-cut hopes fade, but CRE interest remains high
2024 started with high hopes for lower interest rates and overall more attractive cost of capital and returns. However, through the first quarter, those hopes faded, as expectations for interest rate cuts by the Federal Reserve (Fed) were reduced and pushed back on the calendar. Commercial real estate (CRE) asset values are still adjusting to the higher rate environment, particularly in private markets where the full effect of repricing has not been felt. The higher for longer rate environment coupled with the increasingly pressured profit margins across many property sectors may contribute to continued asset devaluations. Yet, the appetite for CRE remains high among many capital allocators and investors, with 25% expecting to deploy capital through 2024.
Q1 2024: Transaction activity slow out the gate
Underlying property fundamentals and operating performance for CRE remain intact and at historically healthy levels in the aggregate; however, there are emerging signs of decreasing profitability across many of the property sectors as property owners and managers work to offset expense inflation and compete with increasing supply in certain markets. Transaction activity remained significantly down through the first quarter of 2024 due to the high-interest rate environment and lack of capital availability. The slow transaction activity, as measured by CRE market technicals (the rolling averages of transaction trends) had shown signs of a potential bottom in mid-2023, but these signs of support faded in the first quarter of 2024. CRE remains an area of concern and criticism by investors (e.g., multiple short sellers targeting companies in the sector) and regulators. However, a number of large portfolio and company transactions through the first quarter, suggest that some investors believe the valuation bottom has been reached.
Figure 1 - US CRE private market activity continues to decline
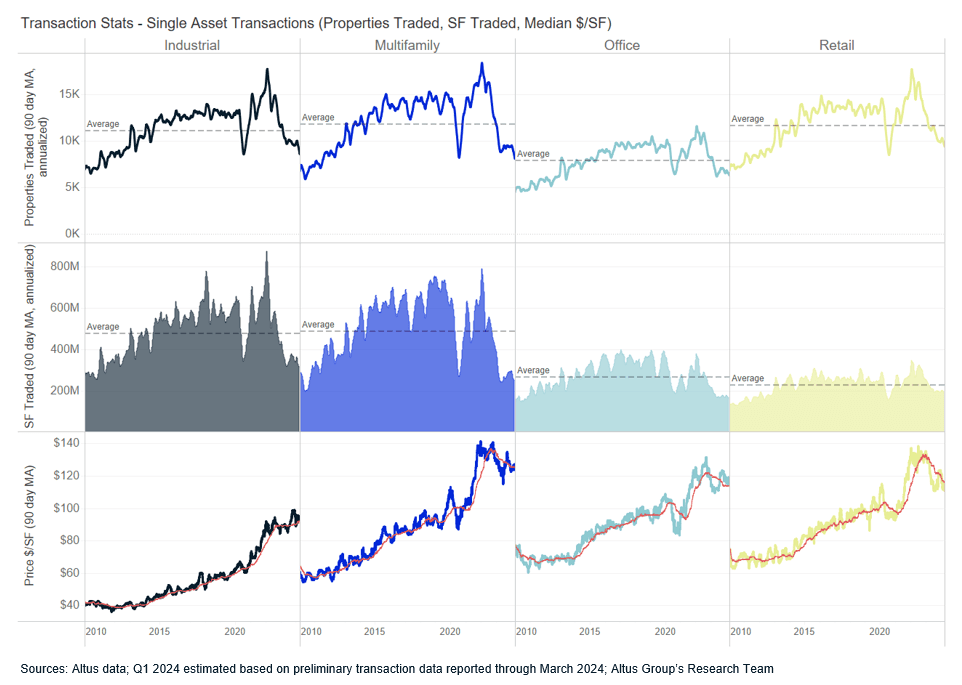
US CRE transaction volume continued to slide through Q1 2024. Cumulative transaction volume across Q1 2024 was the lowest level of volume ($) since 2013. Investment activity, measured by non-distress single-asset transactions, across all property types, with the exception of commercial general (the smallest of the sectors), was down significantly compared to recent years and historical averages.

Figure 2 - A slow start for transaction pacing in 2024
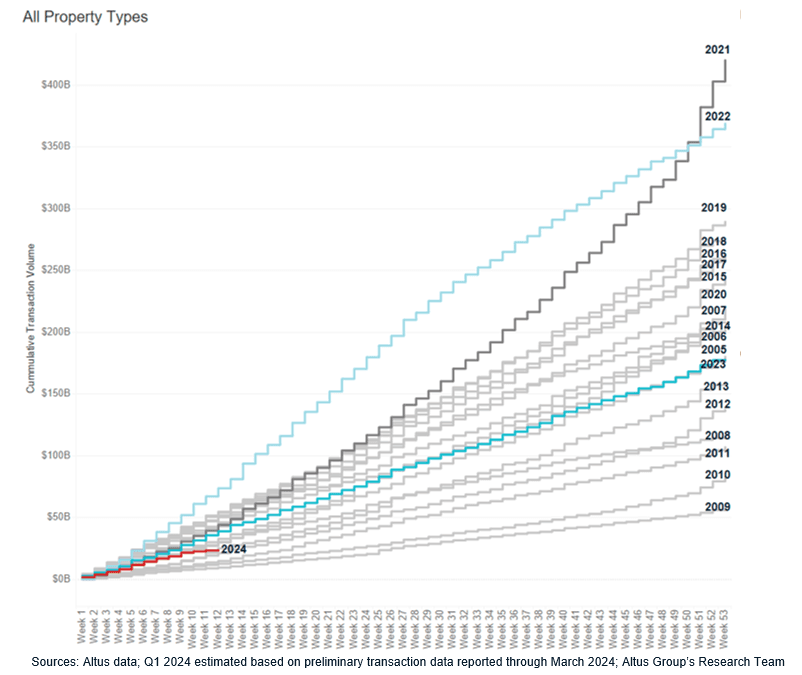
Single-asset transaction activity continues to decline
Through the first quarter of 2024, cumulative CRE transaction volume continued its decline from 2021 and 2022 highs. The $31.6 billion transacted across the major property types through Q1 2024 was down 28% compared to the prior year (Q1 2024 vs Q1 2023). The aggregate transaction volume over Q1 2024 marked the slowest level of activity since early 2013, and 0.7% less than the pandemic nadir in Q2 2020. On a quarter-on-quarter basis, Q1 2024 transaction volumes were down 30%. While all property types saw a slow start to the year, commercial general had a notably large increase, driven by a few large properties, while the main sectors saw declines between 25-38%.
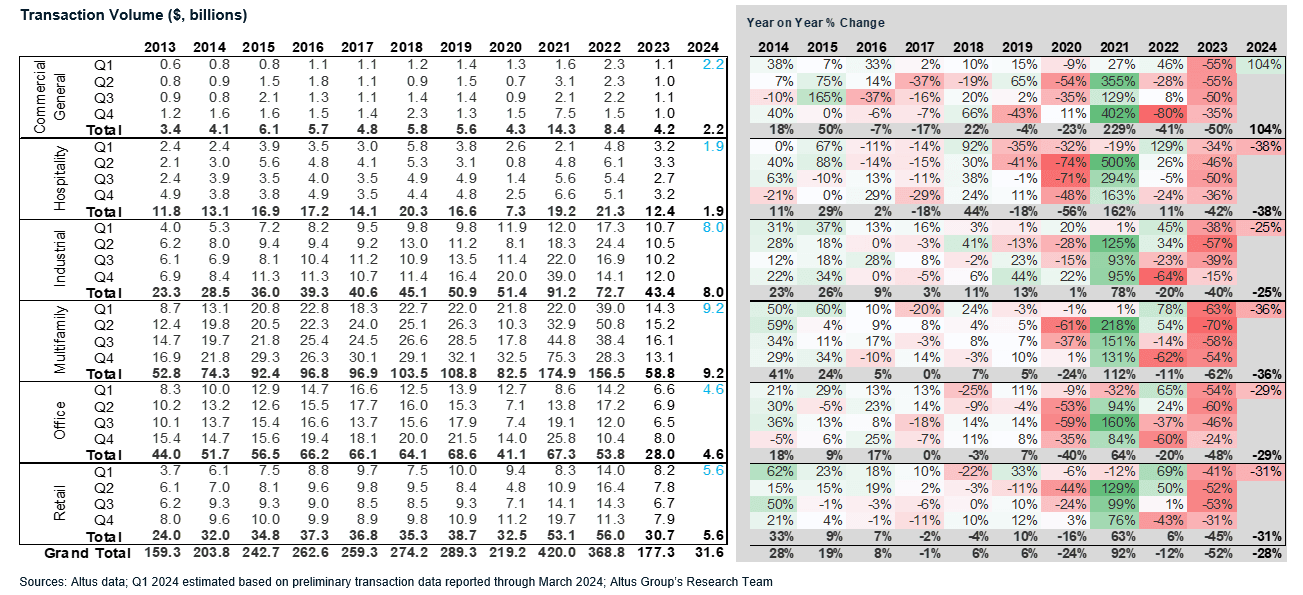
Figure 3 - Quarterly investment activity ($ volume)
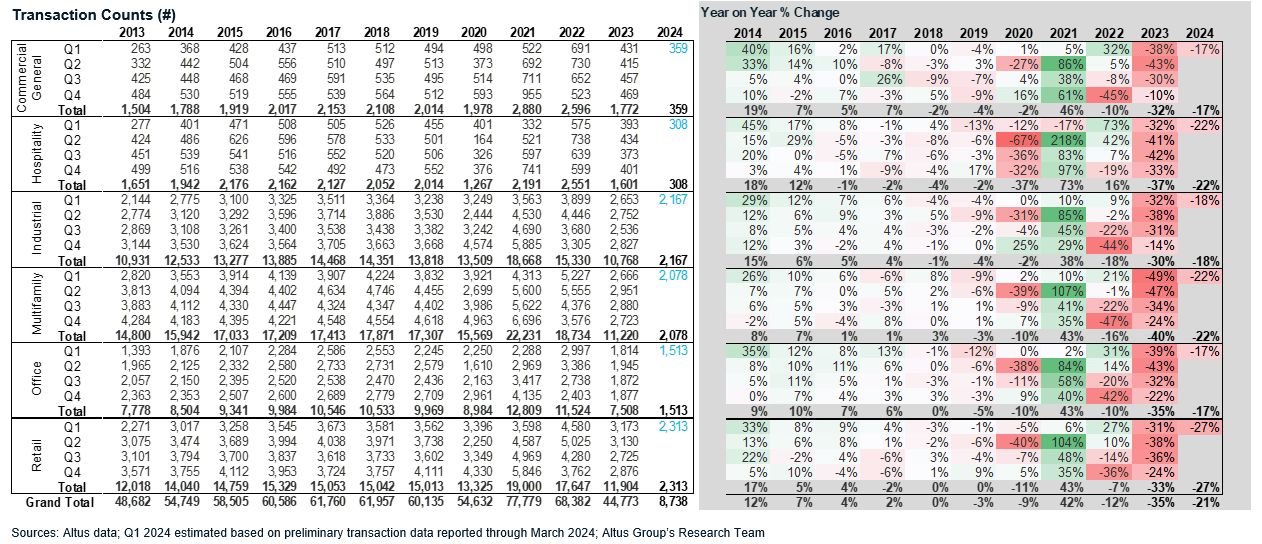
The number of single-asset transactions completed through the first quarter of 2024 was also down significantly compared to the same period a year earlier. The 8,738 properties that transacted during Q1 2024 was 21% less compared to Q1 2023, 8.4% below the Q2 2020 pandemic low and nearly 41% below the long-term historical trend (14,910) set between the years 2005-2023.
Figure 4 - Quarterly investment activity (# traded)
Conclusion
For Q1 2024, CRE transactions across all property sectors were down between 17% (commercial general) and 27% (retail), on a year-on-year basis. A similar magnitude of declines in transactions was seen across property sectors when looking at the data on a quarter-on-quarter basis. Looking at the mix of transactions in the first quarter, most property sectors were within their long-term historical mix by +/-1 percentage points, with the exception of multifamily, which was accounted for 24% of all properties transacted, down 4 percentage points from the sector’s historical 28% of all transactions (based on data between 2005-2023).
Want to be notified of our new and relevant CRE content, articles and events?
Author

Omar Eltorai
Director of Research
Author
Omar Eltorai
Director of Research