Key highlights
Strong consumer spending coupled with retailers’ improved locational intelligence, targeted online marketing, and a surge of creative use types have helped usher in a “retail rally” in recent years
The development pipeline for retail dried up in the aftermath of the Global Financial Crisis (GFC), giving the sector the opportunity to “right-size”; occupancy rates across retail property subtypes have improved from both GFC and pandemic lows
Some retailer bankruptcies have proven to be a net benefit for owners; market-to-contract rent spreads are the highest in more than a decade, making the prospects of backfilling attractive for NOI growth
Will the rise in e-commerce be the end of brick-and-mortar retail?
An estimated 15% of retail sales now occur online, total online sales remain at pandemic-era elevated levels, and growth in the sector now exceeds the pre-pandemic rate. And yet, the rise of technology has still not been all bad news for brick-and-mortar retailers. In fact, a recent rally in the retail sector has put cold water on long-held premonitions that a “retail apocalypse” might occur at the hands of e-commerce.
Figure 1 - E-Commerce as a percentage of total retail sales since Q3 1999
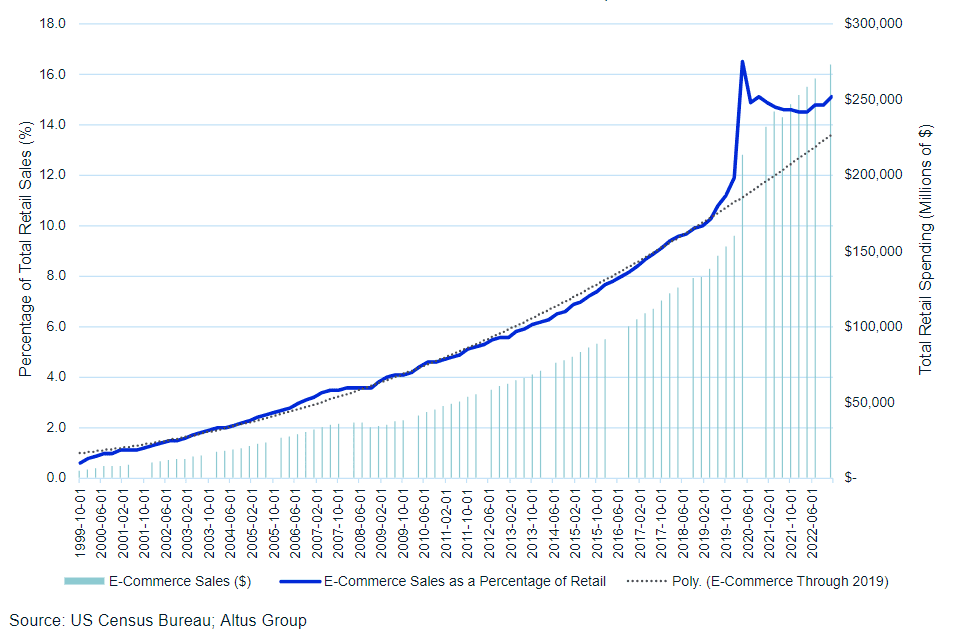
Although the internet ushered in new competition for legacy brick-and-mortar retailers, it also allowed those same legacy retailers to better target new customers, find additional store locations, and launch new creative retail use types.
Estimates suggest that there is less retail square footage per capita than at any point since the aftermath of the GFC, a sign the retail sector is right-sizing and rebalancing from being significantly oversupplied. Across retail property subtypes, capitalization rates remain historically low, occupancy rates exceed pandemic and GFC lows, and market-to-contract rent spreads are growing. What’s beneath the surface of the recent “retail rally”?
Digesting retail’s oversupply
The slimming of the retail pipeline can be illustrated by the development activity of REITs. In late 2007, the retail sector made up nearly one-third of all dollars spent on development. But by Q2 2023, the sector was well outpaced by industrial, multi-family, and even office. At just 5.6% of the REIT development pipeline as of Q2 2023, retail captured the lowest share of the pipeline for any sector aside from office in the early 2000s.
Figure 2 - REIT development pipeline since 2000 by sector
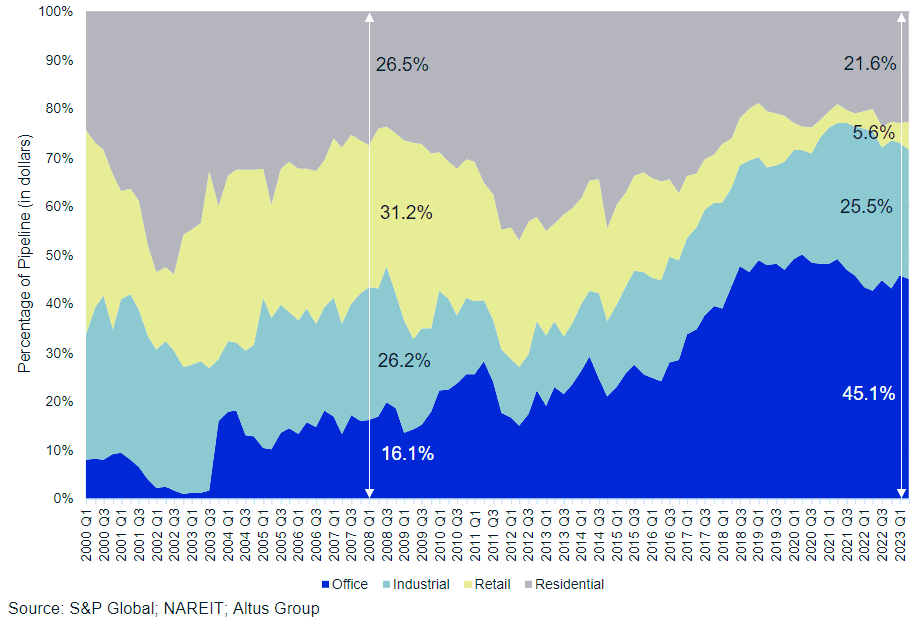
This limited development has not only allowed the sector to optimize its existing space, but retailers themselves have evolved to meet current demands. Enhanced locational intelligence (such as the leveraging of cellular device activity for consumer foot traffic data) has enabled legacy retailers to better understand their customers' demographics, leading to more optimal store placement. At the same time, owners and operators have expanded their focus beyond traditional dry-goods retailers toward more creative and "experiential" retail uses like gyms, entertainment venues, and specialty food shops. Alongside the growth of discount stores and the entry of digitally-native brands into brick-and-mortar retail, these elements have collectively stemmed predicted vacancy losses in institutionally owned retail properties post-GFC.
Keeping track of subtype occupancy
Figure 3 - Occupancy rates across retail property subtypes
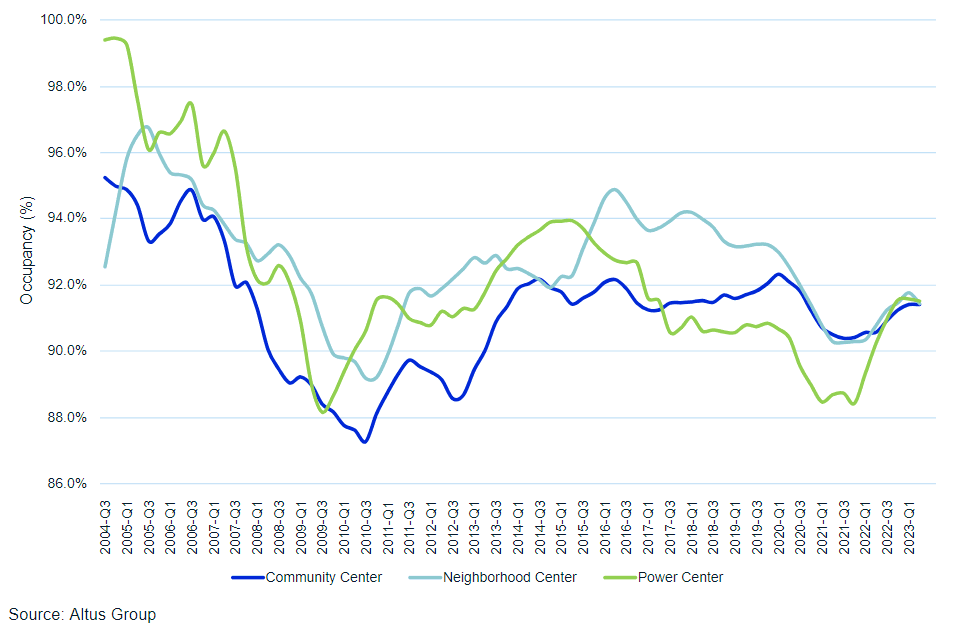
Traditional grocery-anchored shopping centers, also known as "community center retail," have shown surprising resilience. After occupancy at these properties briefly dropped below 88% in 2010, demand rebounded by 2014. Occupancy for community center retail hit 92% in 2014 and remained around there until the pandemic. Grocery-anchored centers were a notable pandemic-era bright spot – previous demand for prepared foods in full-service restaurants was instead channeled into grocers, which have since sustained some of this elevated foot traffic. To this effect, they saw the smallest raw declines in occupancy across subtypes from 2019 to 2021.
Starting in 2015 (coinciding with the growth of online retailers), neighborhood centers with two or more anchor stores began to experience a consistent decrease in occupancy. Similarly, power centers, characterized by their numerous "big box" retailers, also saw a decline in occupancy from 2015 to late 2021. Both have been hot spots for the quickly growing offerings of discount retailers, with power centers being the only subtype to have seen occupancy lurch past immediate pre-pandemic levels. Across all property types, occupancy remains well above GFC and pandemic lows, now converging just shy of 92%.
Capturing back the box
A post-pandemic wave of legacy retail bankruptcies certainly took a short-term toll on institutional owners of retail properties, as evidenced in temporary declines in occupancy. Yet this was not entirely bad news; the collapse of some major tenants such as Bed Bath and Beyond has provided a once-in-a-generation opportunity to capture back desirable boxes in addition to the upside.
Figure 4 - Spread between market rents and in-place contract rents across retail property subtypes
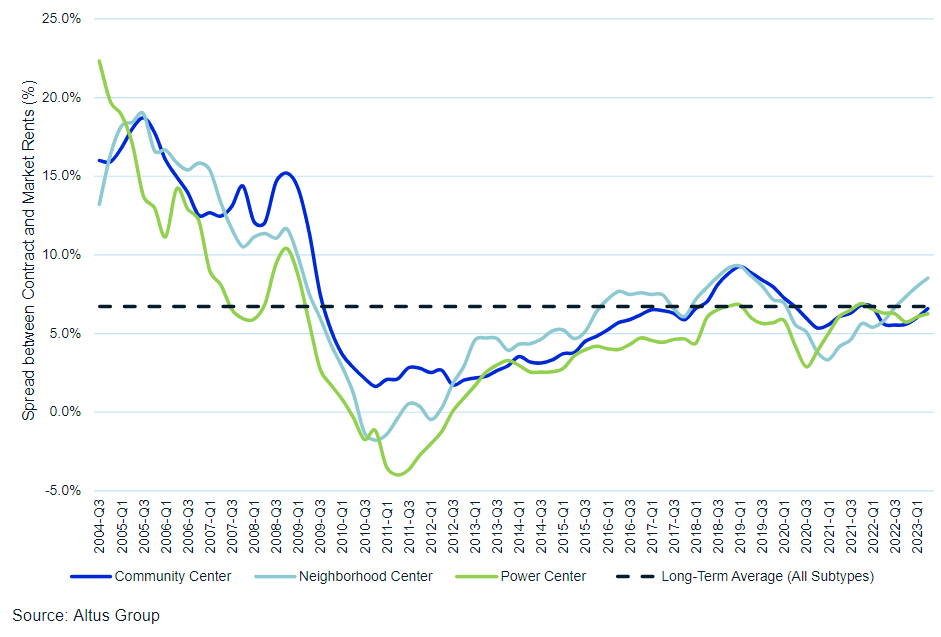
Instead of being tied to retailers in long-term leases with minimal yearly increments in rent, owners have swiftly repurposed spaces. They've attracted a new breed of tenants - discount retailers, brands that previously operated solely through Direct-to-Consumer channels, and businesses focused on experiential offerings. Spreads between market and in-place contracted rents are improving and have approached or exceeded the long-term average across property subtypes.
Looking ahead
After years of headlines and calls for a “retail apocalypse” brought about by the major shift from in-person shopping at brick-and-mortar locations to online shopping and increasingly important e-commerce channels, the recent strong performance by retail properties demonstrates that many of these “end-is-nigh” calls were likely overblown. While the sector has certainly seen its share of painful changes over the past decades (retailer bankruptcies, operating and investment performance swings, digesting oversupply), it has also demonstrated a collective adaptability. The significant rebalancing act that the sector has experienced over the last two decades and the more recent rally, should help to change the broad narrative for retail or, at the very least, eliminate the hackneyed apocalyptic calls.
Author

Cole Perry
Associate Director of Research, Altus Group
Author

Cole Perry
Associate Director of Research, Altus Group
Resources
Latest insights


